Complete Python Selenium Web Scraping Example

Introduction

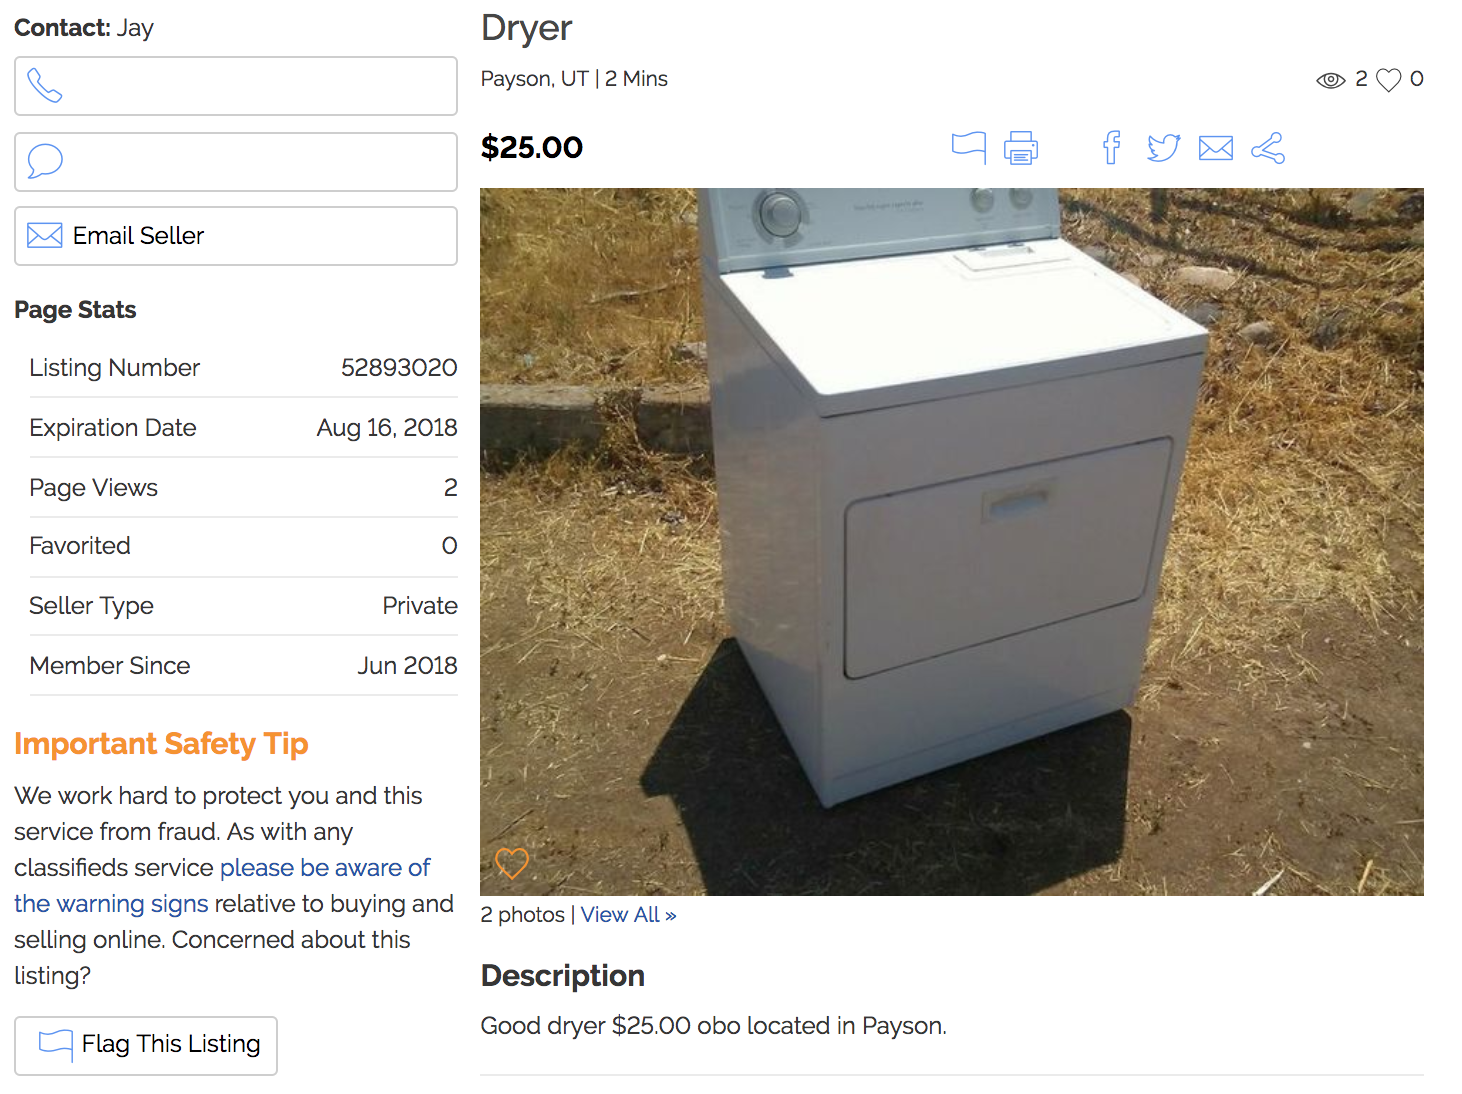
I recently listed a couple of items for sale on a Craigslist-like site called KSL Classifieds. It’s a rich marketplace to buy and sell almost anything. This is what a listing looks like:

ad-example

I instinctively started thinking about how to collect information about listings in this marketplace in a systematic way.  Why might this kind of autotomized data collection be valuable? Here are two possible use cases:

  • Listing optimization. We could analyze how features of a listing (number of pictures, description length, listing category/subcategory, etc.) are related to outcomes such as the number of views, if the item is “favorited” by users, or whether or not the item was sold. This kind of data-driven listing optimization could drive sales for sellers.
  • Automated Item Search. There’s value for buyers as well. Suppose I’m looking for something specific, like a wakeboard for family boating outings. I could easily automate a script to scrape all wakeboard listings daily and send me the information via email, simplifying the search process.

Walkthrough

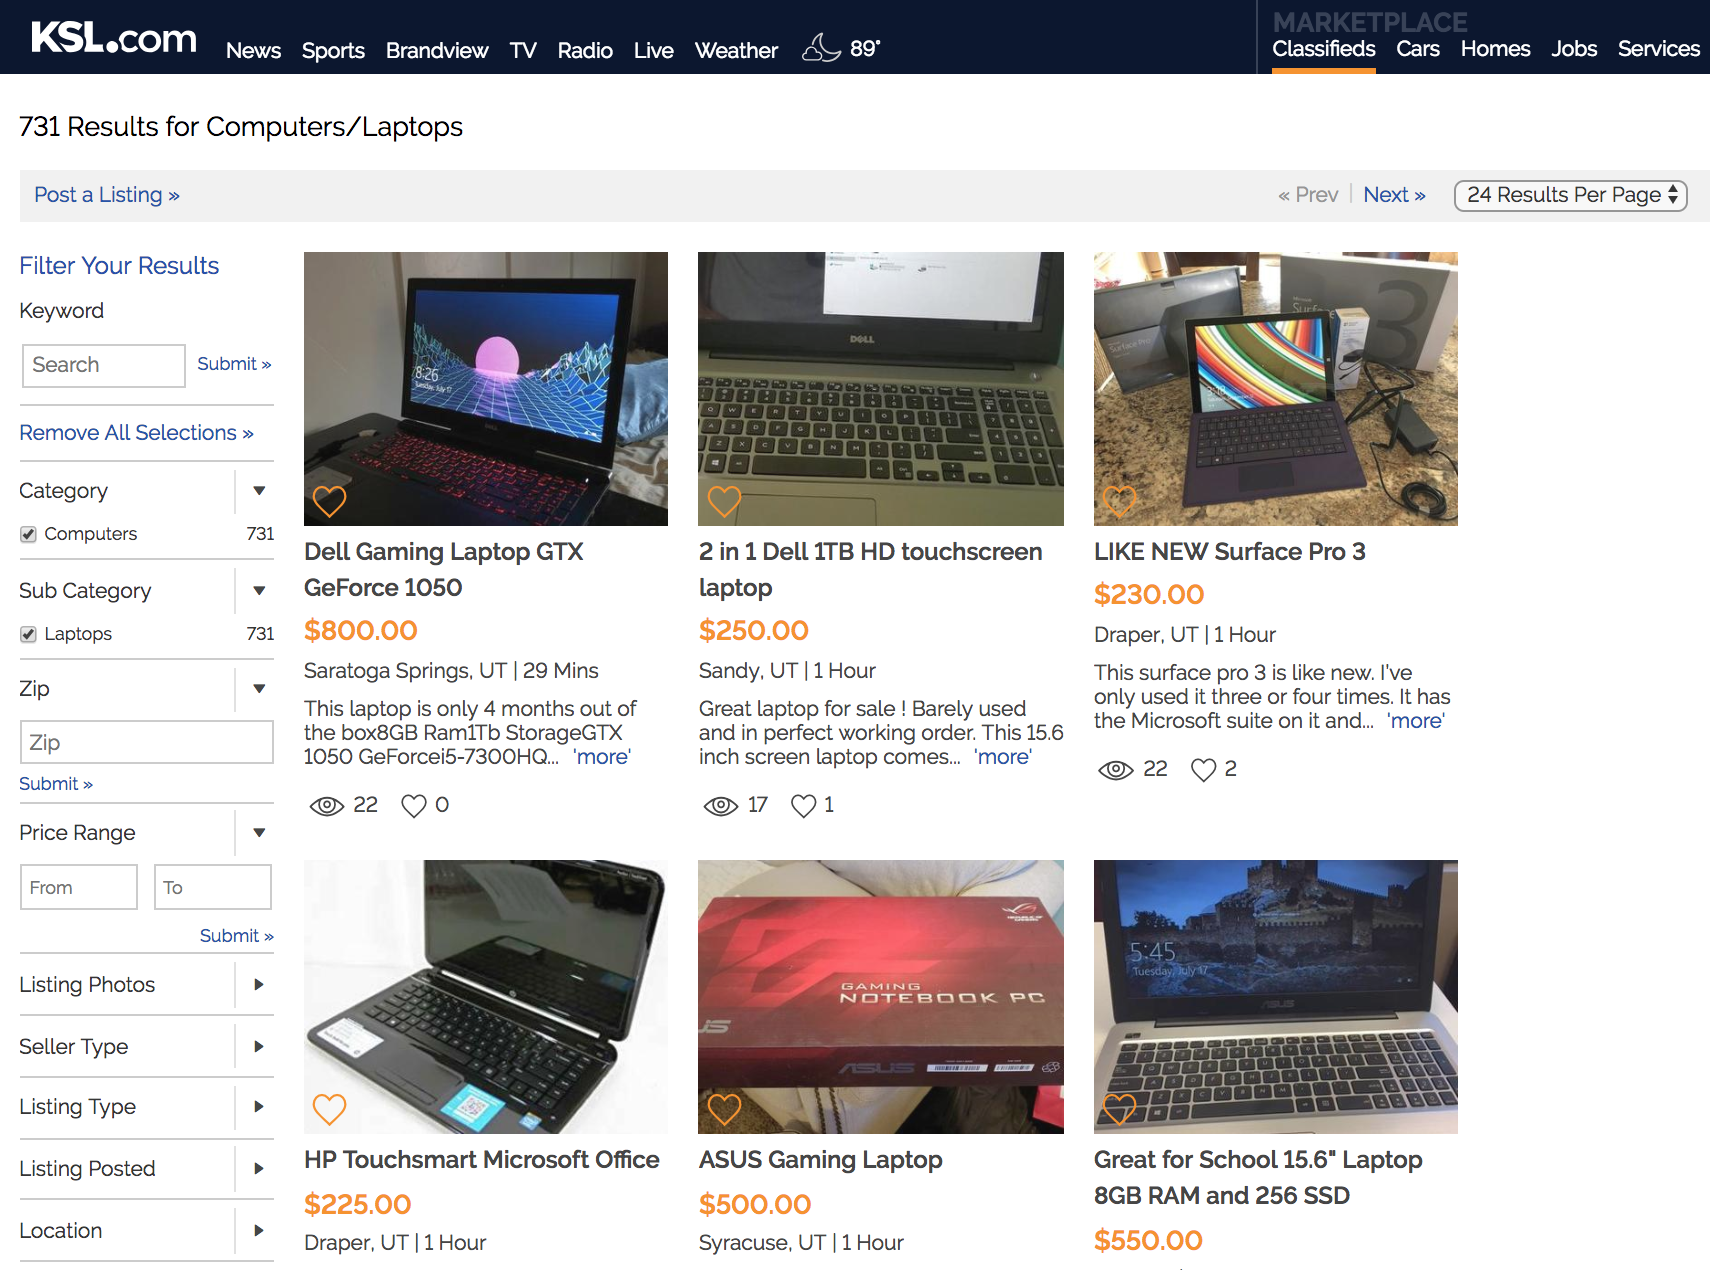
Let’s jump into the walkthrough. At a high level, we know we want our web scraping script to take a KSL Classified URL as input and output a CSV containing neatly-arranged data from each listing. Here’s what the starting page might look like:

search-example

Given this page, we need to find all the links to listings, navigate to each listing page, and then extract the desired information. Each listing contains the following features:

  • Title
  • Location (City, State)
  • Time Posted
  • Price
  • Number of Views
  • Number of Favorites
  • Description
  • Seller Information

With that as background, let’s get into the code. We’ll start by calling the libraries.

Next, we’ll write a function to extract all the listing links from a search result page like the one above.

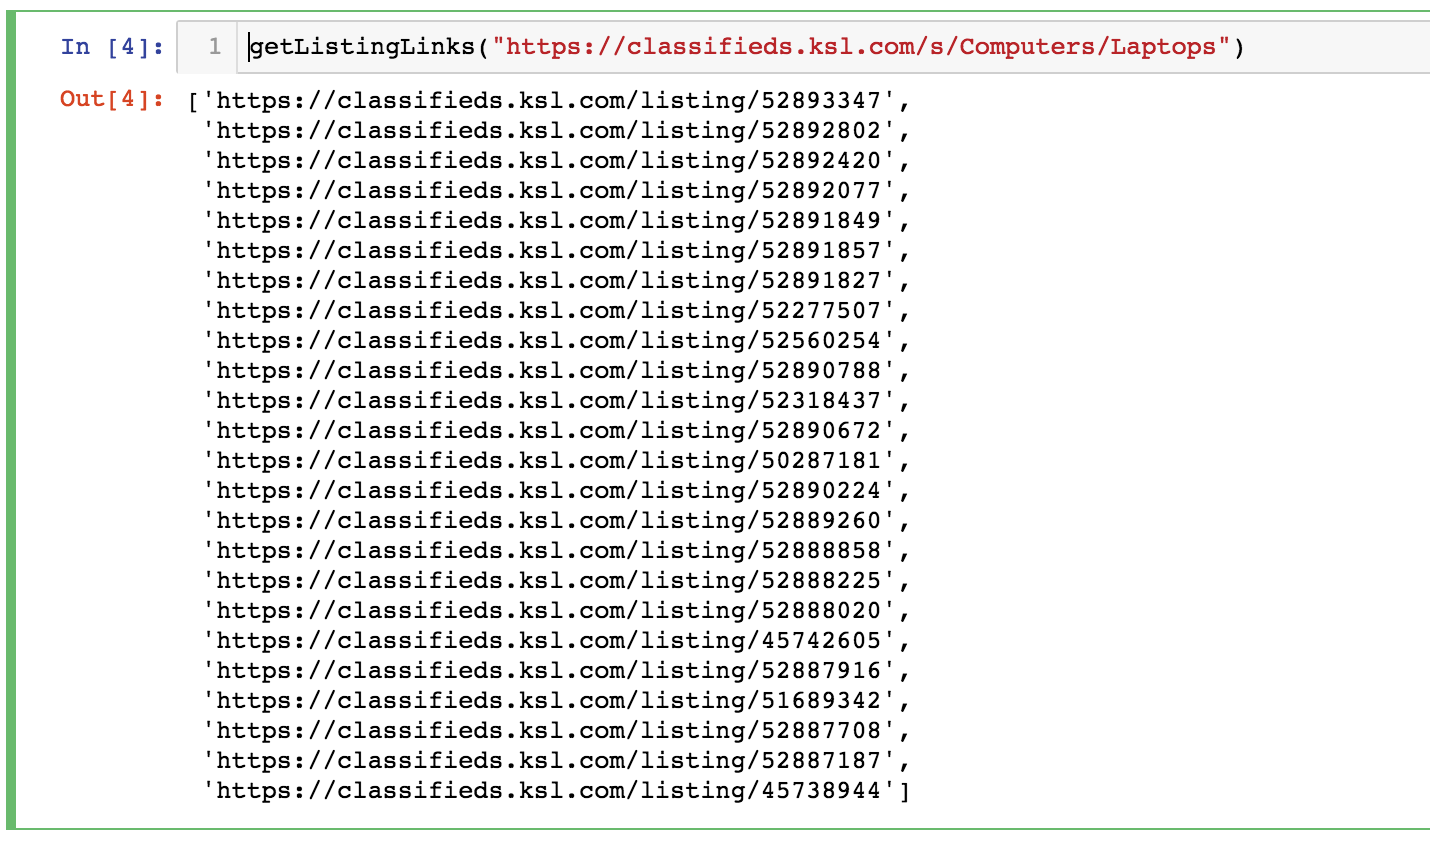
Note that I’m using “ChromeDriver”. It can be downloaded here. Below is what the output of our function looks like. We now have a vector of links to specific listings.

get-listing-links-exampleNow we need to iterate through each of these listings and extract the desired information. Below is a function called getListingContent() which takes a listing link and return the title, location, time since listing posting, price, views, favorites, description, seller, and the listing URL.

Again, here’s what the output of this function would look like:

get-listing-content-example

Pretty slick eh? Now let’s combine these two functions!

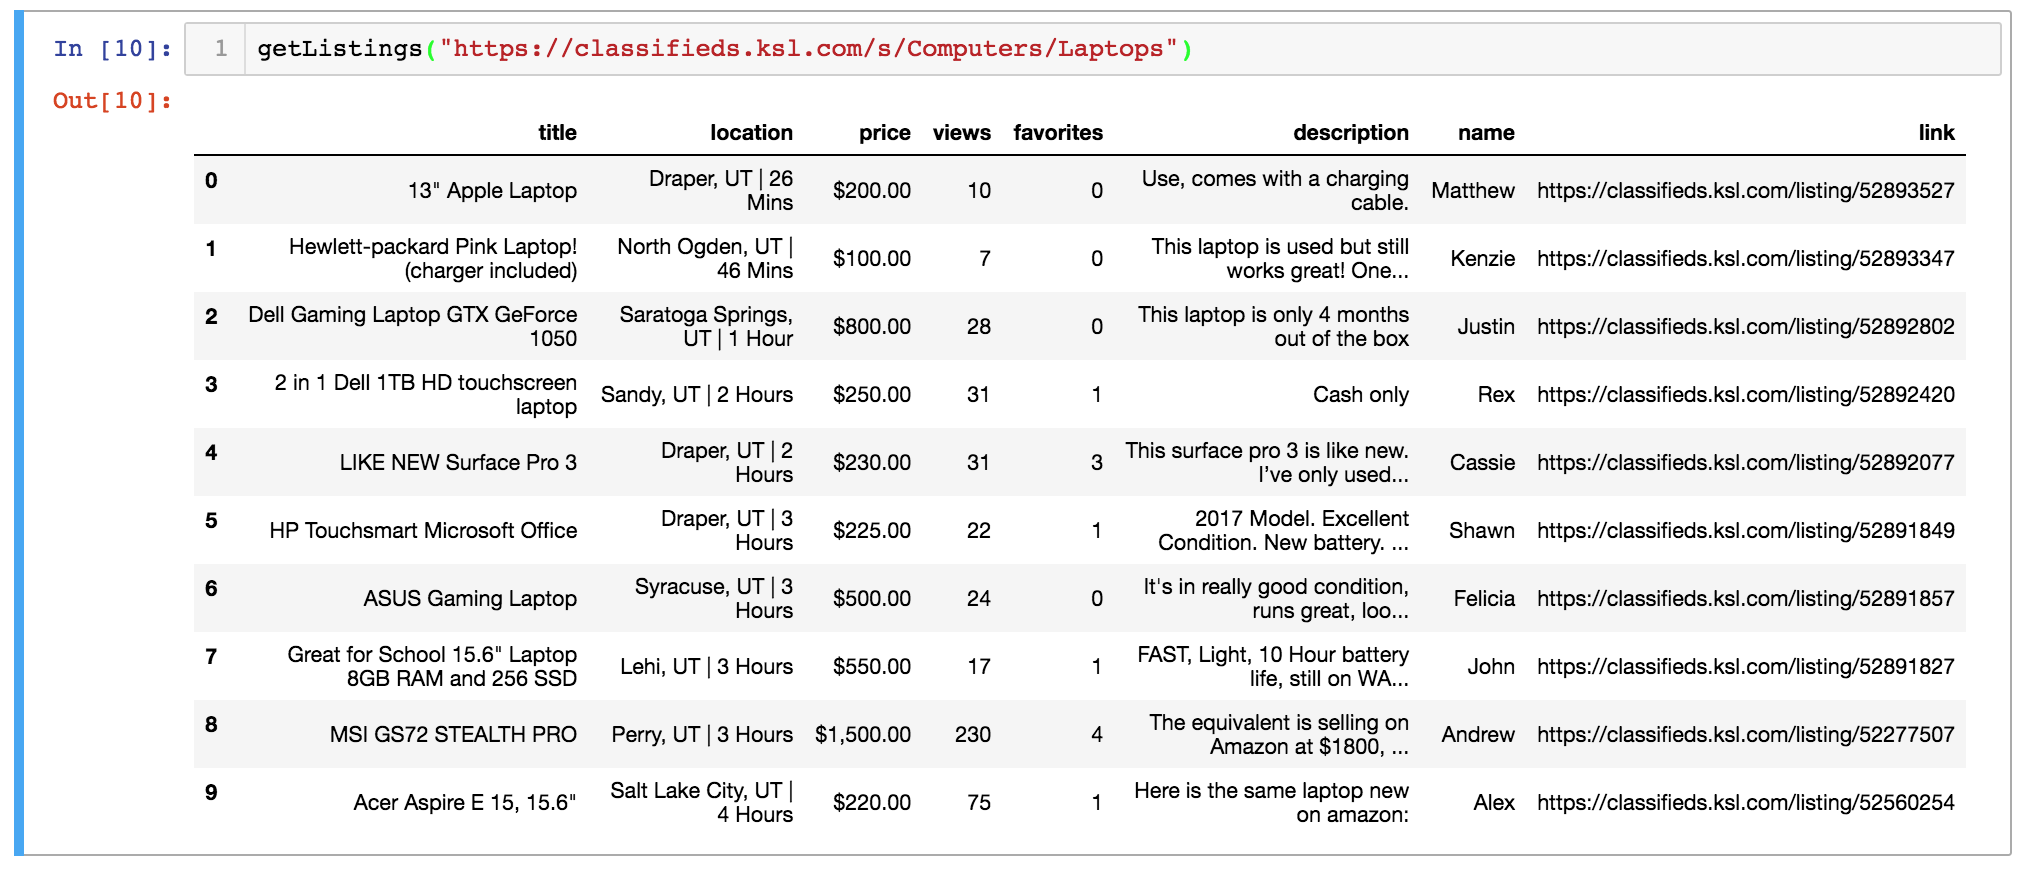
Here we’re only going to loop through the first ten of the listing links gathered by getListingLinks(). After the loop, we’ll neatly arrange the extracted data into a Pandas DataFrame.

get-listings-example

To finish things off, we’ll clean the data. This includes reformatting the “price” variable and changing “views” and “favorites” from strings to numbers.

Finally, let’s tie it all together with the main() function:

Nice work! We can now pass a link to main() and it will generate a tidy CSV file with information about the listing from that page. You can find the complete scraper code here. Below are some resources that proved helpful to me in creating this example:

Interactive Investment Tool with R Shiny

R Shiny is a fantastic framework to quickly develop and launch interactive data applications. I recently wrote some investing advice and was looking for a way to illustrate two case studies. Building on an RStudio template, I created a tool to visualize the return of an investment over time, allowing the user to modify each parameter and observe its effect:

Click here for the full-page (non-embedded) version.

Find the full code here or below:

library(FinCal)
library(ggplot2)
library(tidyr)
library(shinythemes)
library(scales)

# Define UI for application that draws a histogram
ui <- shinyUI(fluidPage(theme = shinytheme("spacelab"),
  # Application title
  titlePanel("The Potential for Growth: Two Case Studies"),
  p('An interactive tool to accompany the ', a(href = 'https://unboxed-analytics.com/life-hacking/fundamentals-of-investing/', '"Fundamentals of Investing"'), 'post.'),
  
  # Sidebar with a slider input for number of bins
  sidebarLayout(
    sidebarPanel(
      numericInput(
        inputId = "rate",
        label = "Yearly Rate of Return",
        value = .06,
        min = .01,
        max = .15,
        step = .01
      ),
      p("Represented as a decimal."),
      p(".06 = 6%"),
      numericInput(
        inputId = "years",
        label = "Number of Years",
        value = 43,
        min = 3,
        max = 50,
        step = 1
      ),
      numericInput(
        inputId = "pv",
        label = "Initial Outlay",
        value = 2000,
        min = 1000,
        max = 100000,
        step = 1000.
      ),
      numericInput(
        inputId = "pmt",
        label = "Monthly Contribution",
        value = 0,
        min = 0,
        max = 10000,
        step = 100
      ),
      numericInput(
        inputId = "type",
        label = "Payment Type",
        value = 0,
        min = 0,
        max = 1,
        step = 1
      ),
      p("Indicates if payments occur at the end of each period (Payment Type = 0) or if payments occur at the beginning of each period (Payment Type = 1).")
      ),
    
    mainPanel(plotOutput("finPlot"),
              p("The grey line represents PRINCIPAL and the blue line represents PRINCIPAL + INTEREST."),
              p("Case 1: Suppose you have $2,000 to invest. You use that money to purchase a low-cost, tax-efficient, diversified mutual fund offering an approximate yearly return of 6%."),
              p("You purchase the mutual fund on your 22nd birthday and don’t check your account until your 65th birthday on the day of retirement. After 43 years, you would have over $26,200! Your money has doubled four times."),
              p("Case 2: Suppose again you have $2,000 today to invest. You purchase shares of the same mutual and now, in addition to the initial investment, purchase $100 of additional shares each month. [Adjust the 'Monthly Contribution' sidebar parameter]"),
              p("How much would you have at the end of 43 years? Over $268,400! You have passively created wealth through the market."))
  )
))

# Define server logic required to draw a histogram
server <- shinyServer(function(input, output) {
  output$finPlot <- renderPlot({

    # processing
    total <- fv(r = input$rate/12, n = 0:(12*input$years), pv = -input$pv, pmt = -input$pmt, type = input$type)
    principal <- seq(input$pv, input$pv + (input$years*12)*(input$pmt+.000000001), input$pmt + .000000001)
    interest <- total - principal
    df <- data.frame(period = 0:(12*input$years), total, principal)
    
    # plotting
    ggplot(df, aes(x = period)) + 
      geom_line(aes(y = total), col = "blue", size = .85) +
      geom_line(aes(y = principal), col = "black", size = .85) +
      labs(x = "Period",
           y = "") + 
      scale_y_continuous(labels = dollar) +
      theme(legend.position="bottom") +
      theme(legend.title = element_blank()) +
      theme_minimal()
  })
})

# Run the application
shinyApp(ui = ui, server = server)

Analyzing iPhone Usage Data in R

I’m constantly thinking about how to capture and analyze data from day-to-day life. One data source I’ve written about previously is Moment, an iPhone app that tracks screen time and phone pickups. Under the advanced settings, the app offers data export (via JSON file) for nerds like me.

Here we’ll step through a basic analysis of my usage data using R. To replicate this analysis with your own data, fork this code and point the directory to your ‘moment.json’ file.

Cleaning + Feature Engineering

We’ll start by calling the “rjson” library and bringing in the JSON file.

library("rjson")
json_file = "/Users/erikgregorywebb/Downloads/moment.json"
json_data <- fromJSON(file=json_file)

Because of the structure of the file, we need to “unlist” each day and then combine them into a single data frame. We’ll then add column names and ensure the variables are of the correct data type and format.

df <- lapply(json_data, function(days) # Loop through each "day"
{data.frame(matrix(unlist(days), ncol=3, byrow=T))})

# Connect the list of dataframes together in one single dataframe
moment <- do.call(rbind, df)

# Add column names, remove row names
colnames(moment) <- c("minuteCount", "pickupCount", "Date")
rownames(moment) <- NULL

# Correctly format variables
moment$minuteCount <- as.numeric(as.character(moment$minuteCount))
moment$pickupCount <- as.numeric(as.character(moment$pickupCount))
moment$Date <- substr(moment$Date, 0, 10)
moment$Date <- as.Date(moment$Date, "%Y-%m-%d")

Let’s create a feature to enrich our analysis later on. A base function in R called “weekdays” quickly extracts the weekday, month or quarter of a date object.

moment$DOW <- weekdays(moment$Date)
moment$DOW <- as.factor(moment$DOW)

With the data cleaning and feature engineering complete, the data frame looks like this:

Minute CountPickup CountDateDOW
131542018-06-16Saturday
53462018-06-15Friday
195642018-06-14Thursday
91522018-06-13Wednesday

For clarity, the minute count refers to the number of minutes of “screen time.” If the screen is off, Moment doesn’t count listening to music or talking on the phone. What about a pickup? Moment’s FAQs define a pickup as each separate time you turn on your phone screen. For example, if you pull your phone out of your pocket, respond to a text, then put it back, that counts as one pickup.

With those feature definitions clarified, let’s move to the fun part: visualization and modeling!

Visualization

I think good questions bring out the best visualizations so let’s start by thinking of some questions we can answer about my iPhone usage:

  1. What do the distributions of minutes and pickups look like?
  2. How does the number of minutes and pickups trend over time?
  3. What’s the relationship between minutes and pickups?
  4. Does the average number of minutes and pickups vary by weekday?

Let’s start with the first question, arranging the two distributions side by side.

g1 <- ggplot(moment, aes(x = minuteCount)) +
  geom_density(alpha=.2, fill="blue") +
  labs(title = "Screen Time Minutes",
       x = "Minutes",
       y = "Density") +
  theme_minimal() + 
  theme(plot.title = element_text(hjust = 0.5))

g2 <- ggplot(moment, aes(x = pickupCount)) +
  geom_density(alpha=.2, fill="red") +
  labs(title = "Phone Pickups",
       x = "Pickups",
       y = "Density") +
  theme_minimal() + 
  theme(plot.title = element_text(hjust = 0.5))

grid.arrange(g1, g2, ncol=2)

On average, it looks like I spend about 120 minutes (2 hours) on my phone with about 50 pickups. Check out that screen time minutes outlier; I can’t remember spending 500+ minutes (8 hours) on my phone!

Next, how does my usage trend over time?

g4 <- ggplot(moment, aes(x = Date, y = minuteCount)) +
  geom_line() +
  geom_smooth(se = FALSE) +
  labs(title = "Screen Minutes Over Time ",
       x = "Date",
       y = "Minutes") +
  theme_minimal() +
  theme(plot.title = element_text(hjust = 0.5))

g5 <- ggplot(moment, aes(x = Date, y = pickupCount)) +
  geom_line() +
  geom_smooth(se = FALSE) +
  labs(title = "Phone Pickups Over Time ",
       x = "Date",
       y = "Pickups") +
  theme_minimal() +
  theme(plot.title = element_text(hjust = 0.5))

grid.arrange(g4, g5, nrow=2)

Screen time appears fairly constant over time but there’s an upward trend in the number of pickups starting in late March. Let’s remove some of the noise and plot these two metrics by month.

moment$monyr <- as.factor(paste(format(moment$Date, "%Y"), format(moment$Date, "%m"), "01", sep = "-"))

bymonth <- moment %>%
  group_by(monyr) %>%
  summarise(avg_minute = mean(minuteCount),
            avg_pickup = mean(pickupCount)) %>%
  filter(avg_minute > 50) %>% # used to remove the outlier for July 2017
  arrange(monyr)

bymonth$monyr <- as.Date(as.character(bymonth$monyr), "%Y-%m-%d")
g7 <- ggplot(bymonth, aes(x = monyr, y = avg_minute)) + 
  geom_line(col = "grey") + 
  geom_smooth(se = FALSE) + 
  ylim(90, 170) + 
  labs(title = "Average Screen Time by Month",
       x = "Date",
       y = "Minutes") +
  theme_minimal() +
  theme(plot.title = element_text(hjust = 0.5))

g8 <- ggplot(bymonth, aes(x = monyr, y = avg_pickup)) + 
  geom_line(col = "grey") + 
  geom_smooth(se = FALSE) + 
  ylim(30, 70) + 
  labs(title = "Average Phone Pickups by Month",
       x = "Date",
       y = "Pickups") +
  theme_minimal() +
  theme(plot.title = element_text(hjust = 0.5))

grid.arrange(g7, g8, nrow=2)
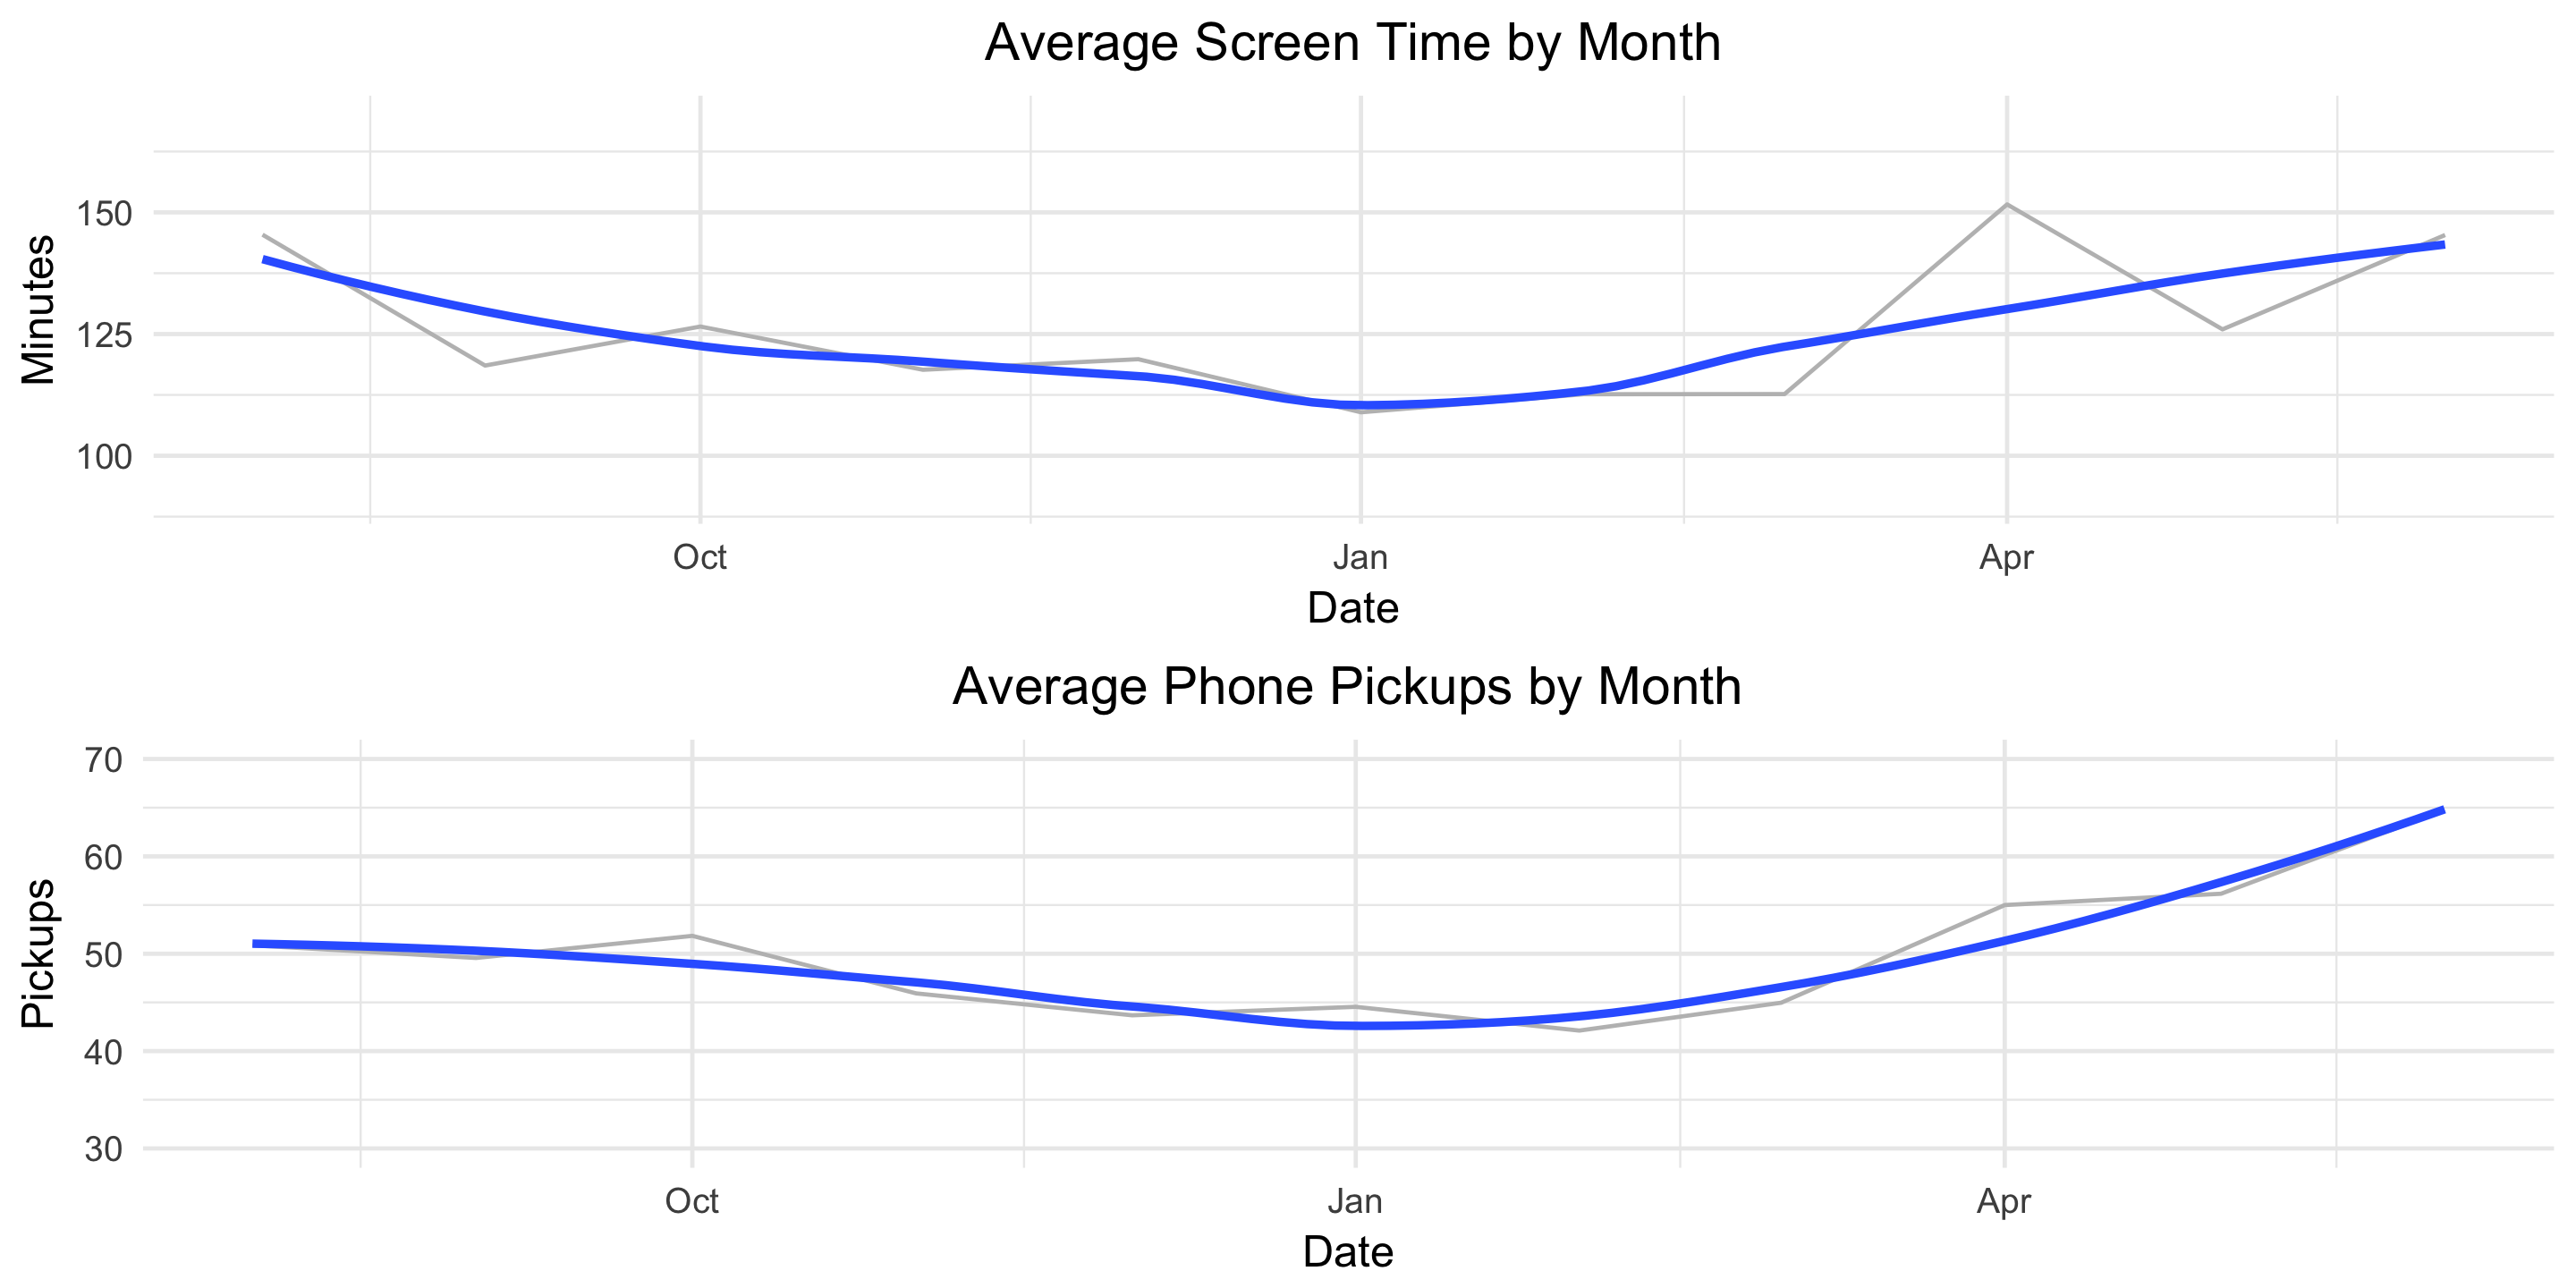
This helps the true pattern emerge. The average values are plotted in light grey and overlayed with a blue, smoothed line. Here we see a clear decline in both screen-time minutes and pickups from August until January and then a clear increase from January until June.

Finally, let’s see how our usage metrics vary by day of the week. We might suspect some variation since my weekday and weekend schedules are different.

byDOW <- moment %>%
  group_by(DOW) %>%
  summarise(avg_minute = mean(minuteCount),
            avg_pickup = mean(pickupCount)) %>%
  arrange(desc(avg_minute))

g10 <- ggplot(byDOW, aes(x = reorder(DOW, -avg_minute), y = avg_minute)) + 
  geom_bar(stat = "identity", alpha = .4, fill = "blue", colour="black") +
  labs(title = "Average Screen Time by DOW",
       x = "",
       y = "Minutes") +
  theme_minimal() +
  theme(plot.title = element_text(hjust = 0.5))

g11 <- ggplot(byDOW, aes(x = reorder(DOW, -avg_pickup), y = avg_pickup)) + 
  geom_bar(stat = "identity", alpha = .4, fill = "red", colour="black") +
  labs(title = "Average Phone Pickups by DOW",
       x = "",
       y = " Pickups") +
  theme_minimal() +
  theme(plot.title = element_text(hjust = 0.5))

grid.arrange(g10, g11, ncol=2)
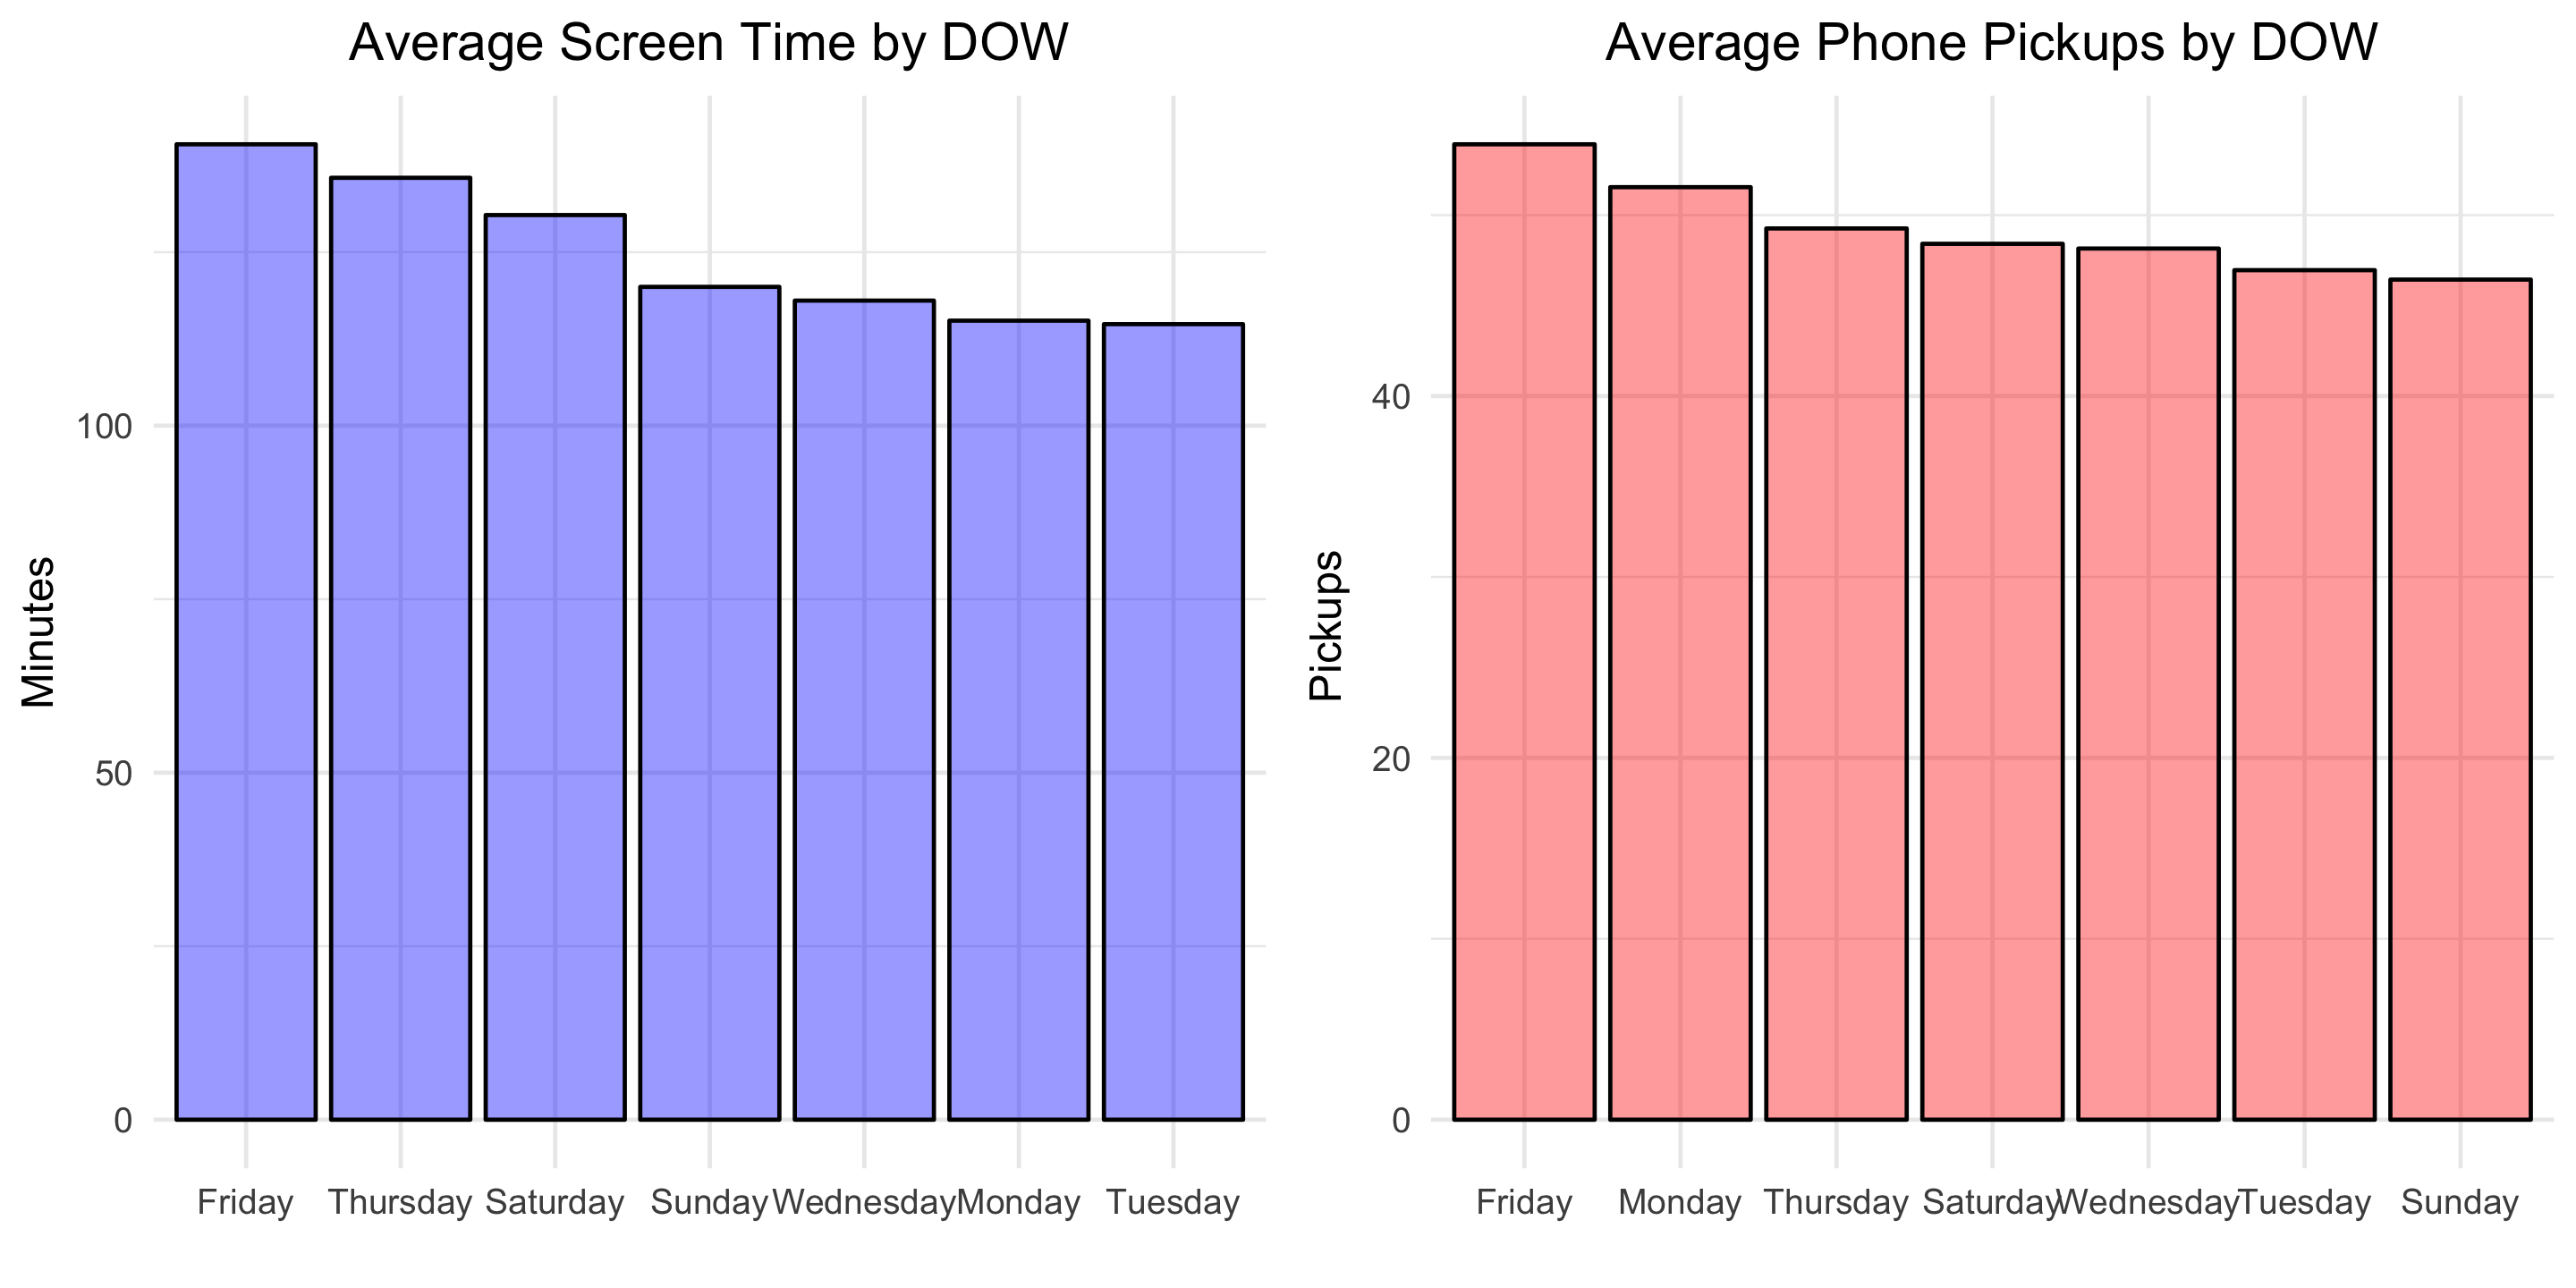
Looks like self-control slips in preparation for the weekend! Friday is the day with the greatest average screen time and average phone pickups.

Modeling

To finish, let’s fit a basic linear model to explore the relationship between phone pickups and screen-time minutes.

fit <- lm(minuteCount ~ pickupCount, data = moment)
summary(fit)

Below is the output:

Coefficients:
            Estimate Std. Error t value Pr(>|t|)    
(Intercept)  39.9676     9.4060   4.249 2.82e-05 ***
pickupCount   1.7252     0.1824   9.457  < 2e-16 ***
---
Signif. codes:  0 ‘***’ 0.001 ‘**’ 0.01 ‘*’ 0.05 ‘.’ 0.1 ‘ ’ 1

Residual standard error: 50.07 on 320 degrees of freedom
Multiple R-squared:  0.2184,	Adjusted R-squared:  0.216 
F-statistic: 89.43 on 1 and 320 DF,  p-value: < 2.2e-16

This means that, on average, each additional phone pickup results in 1.7 minutes of screen time. Let’s visualize the model fit.

g13 <- ggplot(moment, aes(x = pickupCount, y = minuteCount)) + 
  geom_point(alpha = .6) + 
  geom_smooth(method = 'lm', formula = y ~ x, se = FALSE) +
  #geom_bar(stat = "identity", alpha = .4, fill = "blue", colour="black") +
  labs(title = "Minutes of Screen Time vs Phone Pickups",
       x = "Phone Pickups",
       y = "Minutes of Screen Time") +
  theme_minimal() +
  theme(plot.title = element_text(hjust = 0.5))

You can find all the code used in this post here. Download your own Moment data, point the R script towards the file, and Voila, two dashboard-type images like the one below will be produced for your personal enjoyment.

What other questions would you answer?
5 Essential iPhone Apps

I’m always looking for apps that enhance my life and productivity. A family member recently purchased a new iPhone and asked for my top app recommendations. Here are five, in no particular order:

1. LastPass [Link]

One master password (or touch ID) unlocks all other passwords, eliminating the need for frequent password resetting. Available both as a mobile app or Chrome extension, LastPass seamlessly and securely syncs across devices. My LastPass ‘vault’ contains overs 125 of my passwords, and with features like autofill and auto-login, my work is never slowed by manual password entry.

2. Pocket [Link]

Everyday I see dozens of things online I don’t have time to read or view in the moment. With Pocket I can save those news articles, blog posts, talks, or tutorials for later viewing, even if offline. Pocket allows me to organize things I’ve saved with tags and eliminates the need for me to send links to myself via email or bookmark web pages. Pocket’s recommendation algorithm (optimized based on the content saved) is spot-on and delivers interesting and relevant articles for me to consume on demand.

3. Moment [Link]

As useful as having a computer in your pocket can be, it’s important to be aware of your device usage and ‘screen time.’ Moment allows me to track how much I use my phone or tablet each day automatically. The ‘insight’ tab provides useful metrics like minutes of screen time, percent of waking life on phone, and the number of pickups by day and week. Moment helps ensure my device usage remains within a healthful limit.

4. Mint [Link]

The king of the personal finance apps, Mint aggregates all of your financial accounts and allows you to manage your money from one place. Rather than check my bank, credit card, and investment accounts separately, Mint displays my nine account balances in near real-time. I’m also able to view my credit score, receive bill reminders, create budgets by category, and set financial goals. Mint is an essential for the financially-savvy.

5. Google Keep [Link]

Google Keep is hand’s down my go-to productivity and note-keeping app, allowing me to capture and record any thought or plan tasks. It’s really an extension of my brain. With features like check-markable boxes for to-do lists and searchable note archives, Keep is an app I interact with dozens of times a day across my devices.

What apps do you love?

css.php