Building a Birthday Text Bot using Twilio

A good way to show family and friends you care is remembering their birthday. It seems simple enough but in practice, birthday tracking for anyone beyond immediate family and very close friends can be time consuming. Thankfully, you can automate that!

While outsourcing birthday check-in duties does feel a bit impersonal, you can always follow up on the generic message after getting a reply. This post is a tutorial for building a birthday text bot using Twilio.

The first step to building a birthday bot is storing the list of birthdays and contact information somewhere. In this example, I’ve used Coda.io to store name, birthday, and phone number. While I’d prefer to use Google Sheets, Coda’s API interface makes it very easy to import data into the Python environment. Authentication occurs via a bearer token and the API returns a JSON file.

After a bit of unpacking and cleaning, we have a birthday data frame like the one below (this is dummy data, for obvious privacy reasons).

Next, since this code will be deployed to a server and run on a daily schedule, we need to determine which, if any, of our family or friends is celebrating their birthday today.

Finally, we need to tap into the power of Twilio to send the actual SMS message. Twilio is a really cool API service that allows you to programmatically make phone calls and send or receive text messages.

twilio.com

The actual code required to make the birthday bot come to life only requires about eight lines of code. After supplying an account identifier and authentication token, the message client takes as input the body of your text, your Twilio number, and the recipient’s phone number.

That’s it! Let’s see what the message looks like on the recipient’s end.

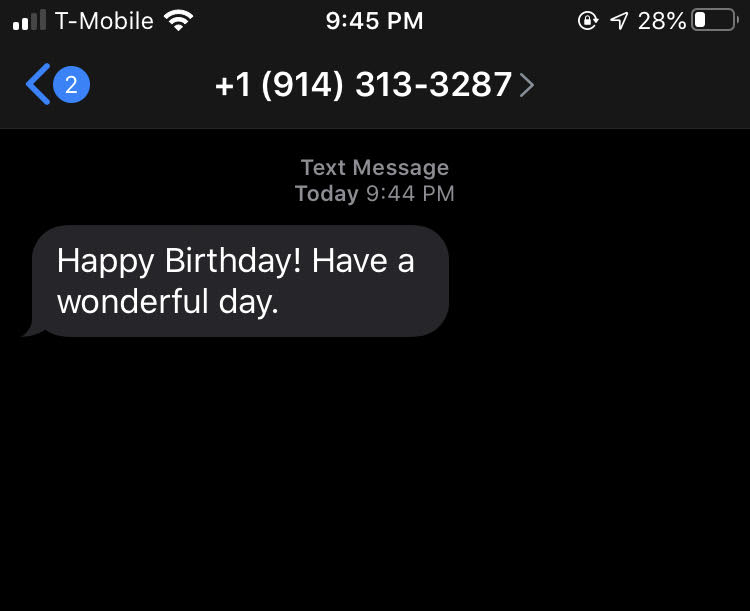
Very slick. By connecting a database (Coda.io) to a messaging API (Twilio), we’ve created a simple birthday text service, capable of earning you the reputation of most thoughtful friend. Enjoy!

Full code can be found on GitHub here.

Feature photo by Sarah Pflug from Burst.

Building a Lyrics Profanity Analyzer with R Shiny

A few weeks ago, a family member asked me to make them a Spotify playlist with recent rap hits. To avoid including anything excessively profane, I’d pull up the song lyrics on genius.com and manually search for potentially offensive words or phrases. Looking to streamline this process (and have a bit of fun with Shiny Apps), I built a simple tool that quickly measures profanity in any song, based on lyrics from genius.com.

The app is embedded below, but you can find a full-screen version here. Here are some sample songs to try out:

  • “Rap God”: https://genius.com/Eminem-rap-god-lyrics
  • “The London”: https://genius.com/Young-thug-the-london-lyrics
  • “Money in the Grave”: https://genius.com/Drake-money-in-the-grave-lyrics

Building the App

The first step was to create a list of offensive words to check song lyrics against. The list I used was by developed by Luis von Ahn. As he notes on his resource page, “the list contains some words that many people won’t find offensive, but it’s a good start for anybody wanting to block offensive or profane terms on their site.”

Next, I needed to develop a function to scrape the lyrics from genius.com, tidy the text into a data frame format, and summarize the profanity by count in descending order.

Finally, I needed an interface for users to interact with. Luckily, the shiny package makes this easy. After importing the profanity list, writing the genius.com scrape function, and building the Shiny app interface locally, I was ready to deploy it to shinyapps.io.

Voila! Now I have a basic tool to quickly summarize profanity in any song found on genius.com.

Hopefully this will come in handy next time I need to put together a “family friendly” mix for events, parties, or road trips. You can find the GitHub repo for this project here, and can access the Shiny app directly here.

Feature photo by Matthew Henry from Burst.

Studying Trends in World Religion using R

Using a data set from the Pew Research Center, this post is about unpacking trends in world religion. The data set contains estimated religious compositions by country from 2010 to 2050.

Sourcing the Data

Made readily available via Github, the file was easy to import into the R environment. Reshaping the data (wide to long format) using the tidyverse “gather” function simplifies plotting down the road.

After reshaping, the data resembles the table below:

Visualizations

Let’s start by visualizing religious composition by region over time.

A few observations:

  • Asia-Pacific has the least concentrated religious mix, with a “rainbow” assortment of Hindus, Muslims, and Buddhists.
  • Christianity is on the decline in North American and Europe.
  • Simultaneously, the percentage of people reporting to be “unaffiliated” with any religion is growing in North America and Europe.

Next, let’s take a look at the least religious countries.

Any patterns of interest?

  • Most of the least religious countries are in Europe and Asian.
  • The Czech Republic tops the list with 76% unaffiliated, beating communist North Korea by a full five percentage points.
  • 50%+ of the China, Hong Kong, and Japan population is non-religious.

Lastly, what will change between 2010 and 2050?

For simplicity, I’ve only included differences greater or less than 2%.

  • Again, we see evidence of a decline in the percentage of Christians globally, although it appears to be most concentrated in Europe and Sub-Saharan Africa.
  • Meanwhile, a larger portion of the population in places like Europe and Asia-Pacific is expected to be Muslim or non-religious.

Conclusion

This was a good exercise in brainstorming ways to slice a seemingly simple data set in pursuit of insights. You can find the data set for your own analysis here, or find the code that produced the visuals here.

Featured photo by Janilson Alves Furtado from Burst.
css.php