Choosing the Right Hospital: Exploratory Analysis in R

With our baby’s due date quickly approaching, my wife and I needed to find a hospital for delivery. Hoping to contribute something meaningful to the decision, I found data published by the state of New York on labor and delivery metrics. By visualizing measures like percentage of cesarean deliveries, I narrowed the list of hospitals within our county.

Despite my belief in “data-driven” decision-making, I understand that in the real world, most decisions are part art, part science, requiring a mix of qualitative and quantitative factors. That being said, in this post, I describe how I leveraged publicly-available data to help choose a hospital for my wife’s delivery.

Data Overview

The dataset spans a ten-year period, from 2008 to 2016, with data for 146 hospitals in 52 counties. Four general categories of metrics are present:

  • Anesthesia & Analgesia       
  • Characteristics of Labor & Delivery
  • Infant Feeding Method
  • Route & Method

Since I lack the subject matter expertise to understand something like the difference between paracervical and pudendal anesthesia, some of the value of the dataset is lost. Despite the knowledge gaps, I’ll next visualize some of the more straightforward measures of labor and delivery to uncover insights about hospital quality.

Visualization & Analysis

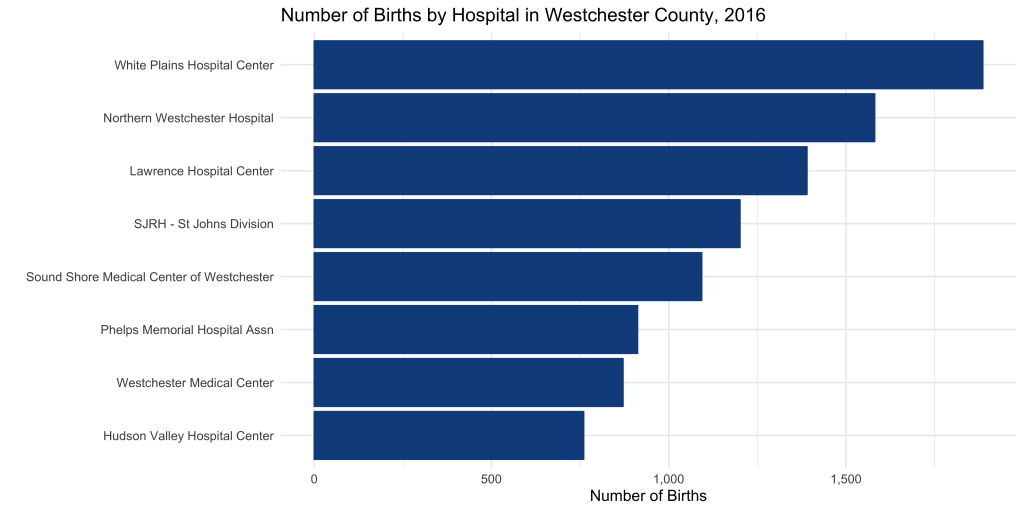
First item of discussion: Where are most babies born in Westchester County?

In 2016, the most babies were born at the White Plains Hospital Center.

Volume may matter. Hospitals who deliver more babies may be exposed a wider spectrum of complications and be prepared to deliver treatment accordingly. On the other hand, large-scale operations likely produce strict standardized policies and procedures, with little room for customized delivery plans.

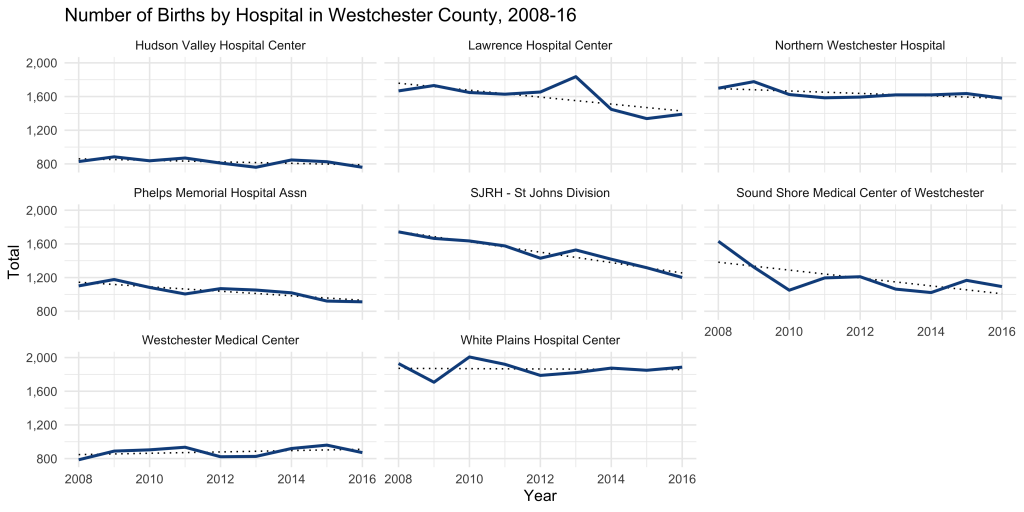
How has the volume of births change over the 10-year period? 

Every hospital seems to be trending flat or down, which may be a reflection of more general demographic trends.

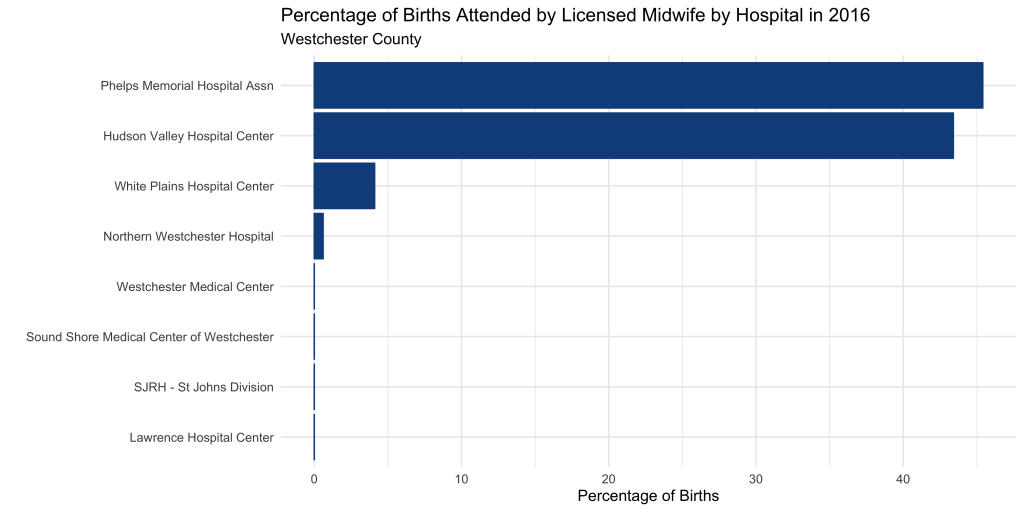
Next up, let’s examine which hospitals work with midwives. This was an important consideration in our decision process.

Pretty clear. Phelps Memorial and Hudson Valley Hospitals are midwife friendly, with 40%+ of births attended by a midwife.

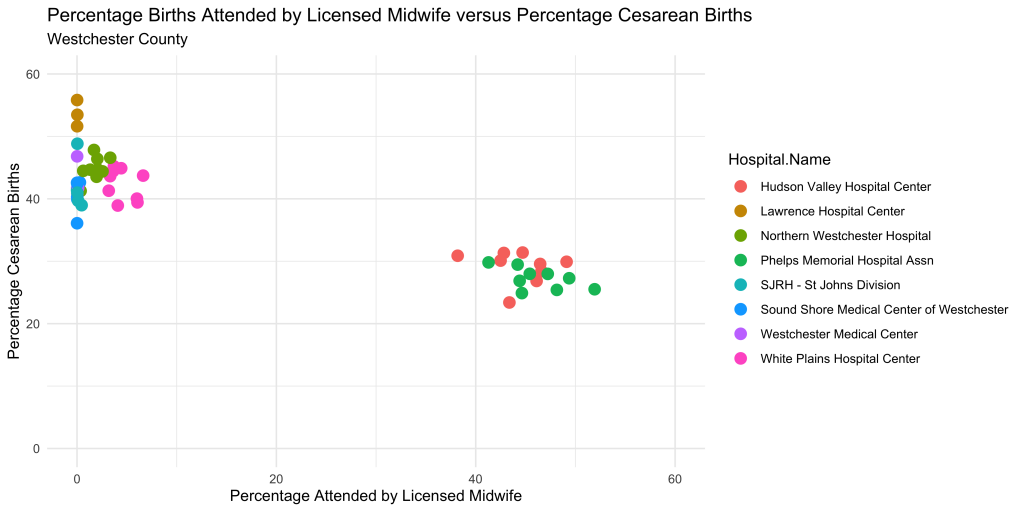
Is there any relationship between births attended by midwifes and other labor outcomes?

It appears that mid-wife friendly hospitals enjoy a lower c-section rate, although I’m not implying that one causes the other. It would take more than a scatter plot to tease out the true nature of that relationship.

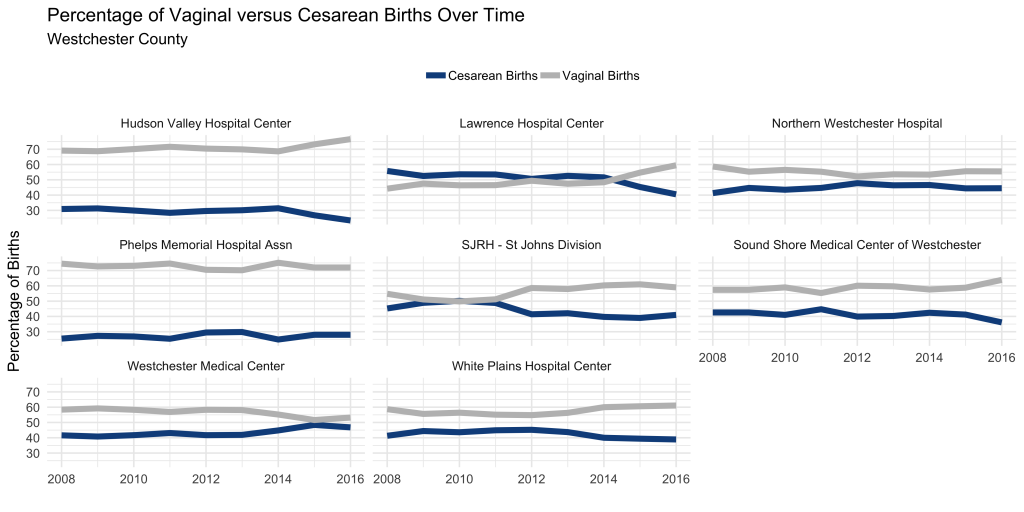
Let’s take a closer look at c-section rates by hospital over time.

There was a long stretch of time at Lawrence hospital where more cesarean sections were performed than vaginal births. Easy red flag!

This simple analysis was informative and eye-opening. With the list significantly narrowed, it’s time to tour the facilities, read reviews, and speak with medical providers to make the final decision.

Here’s a link to the code and data. Thanks for reading!

Visualizing NYC Housing Trends with gganimate in R

StreetEasy, NYC’s leading real estate marketplace, makes some fantastic housing data freely available through its data dashboard. Among the datasets available for download is a monthly breakdown of housing inventory by borough and neighborhood over the last 8 years. In this post I’ll use the gganimate package in R to visualize the ebb and flow of rental housing availability in NYC. If the law of supply and demand holds, this should inform ideal times for apartment hunting.

Rental Inventory Over Time

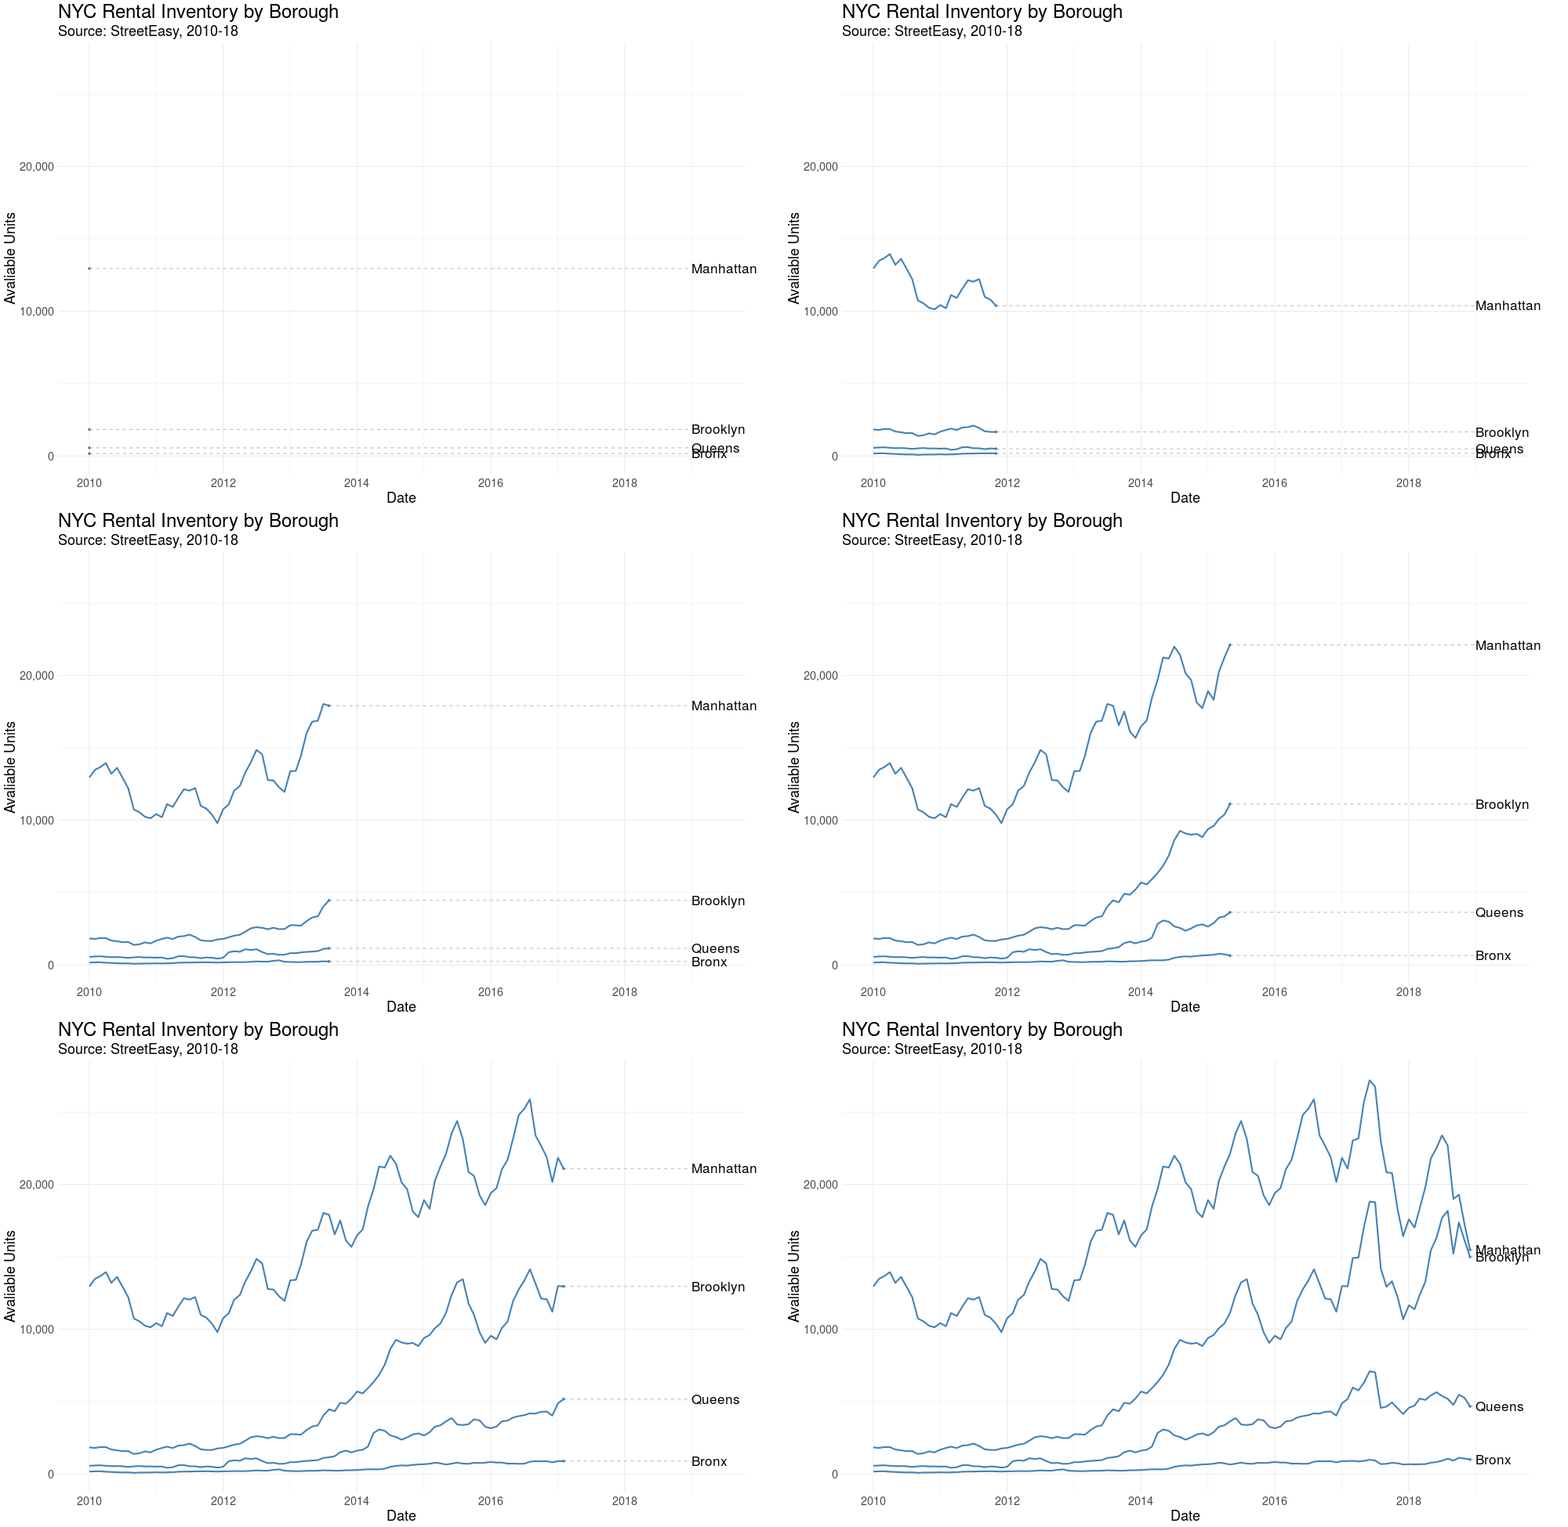
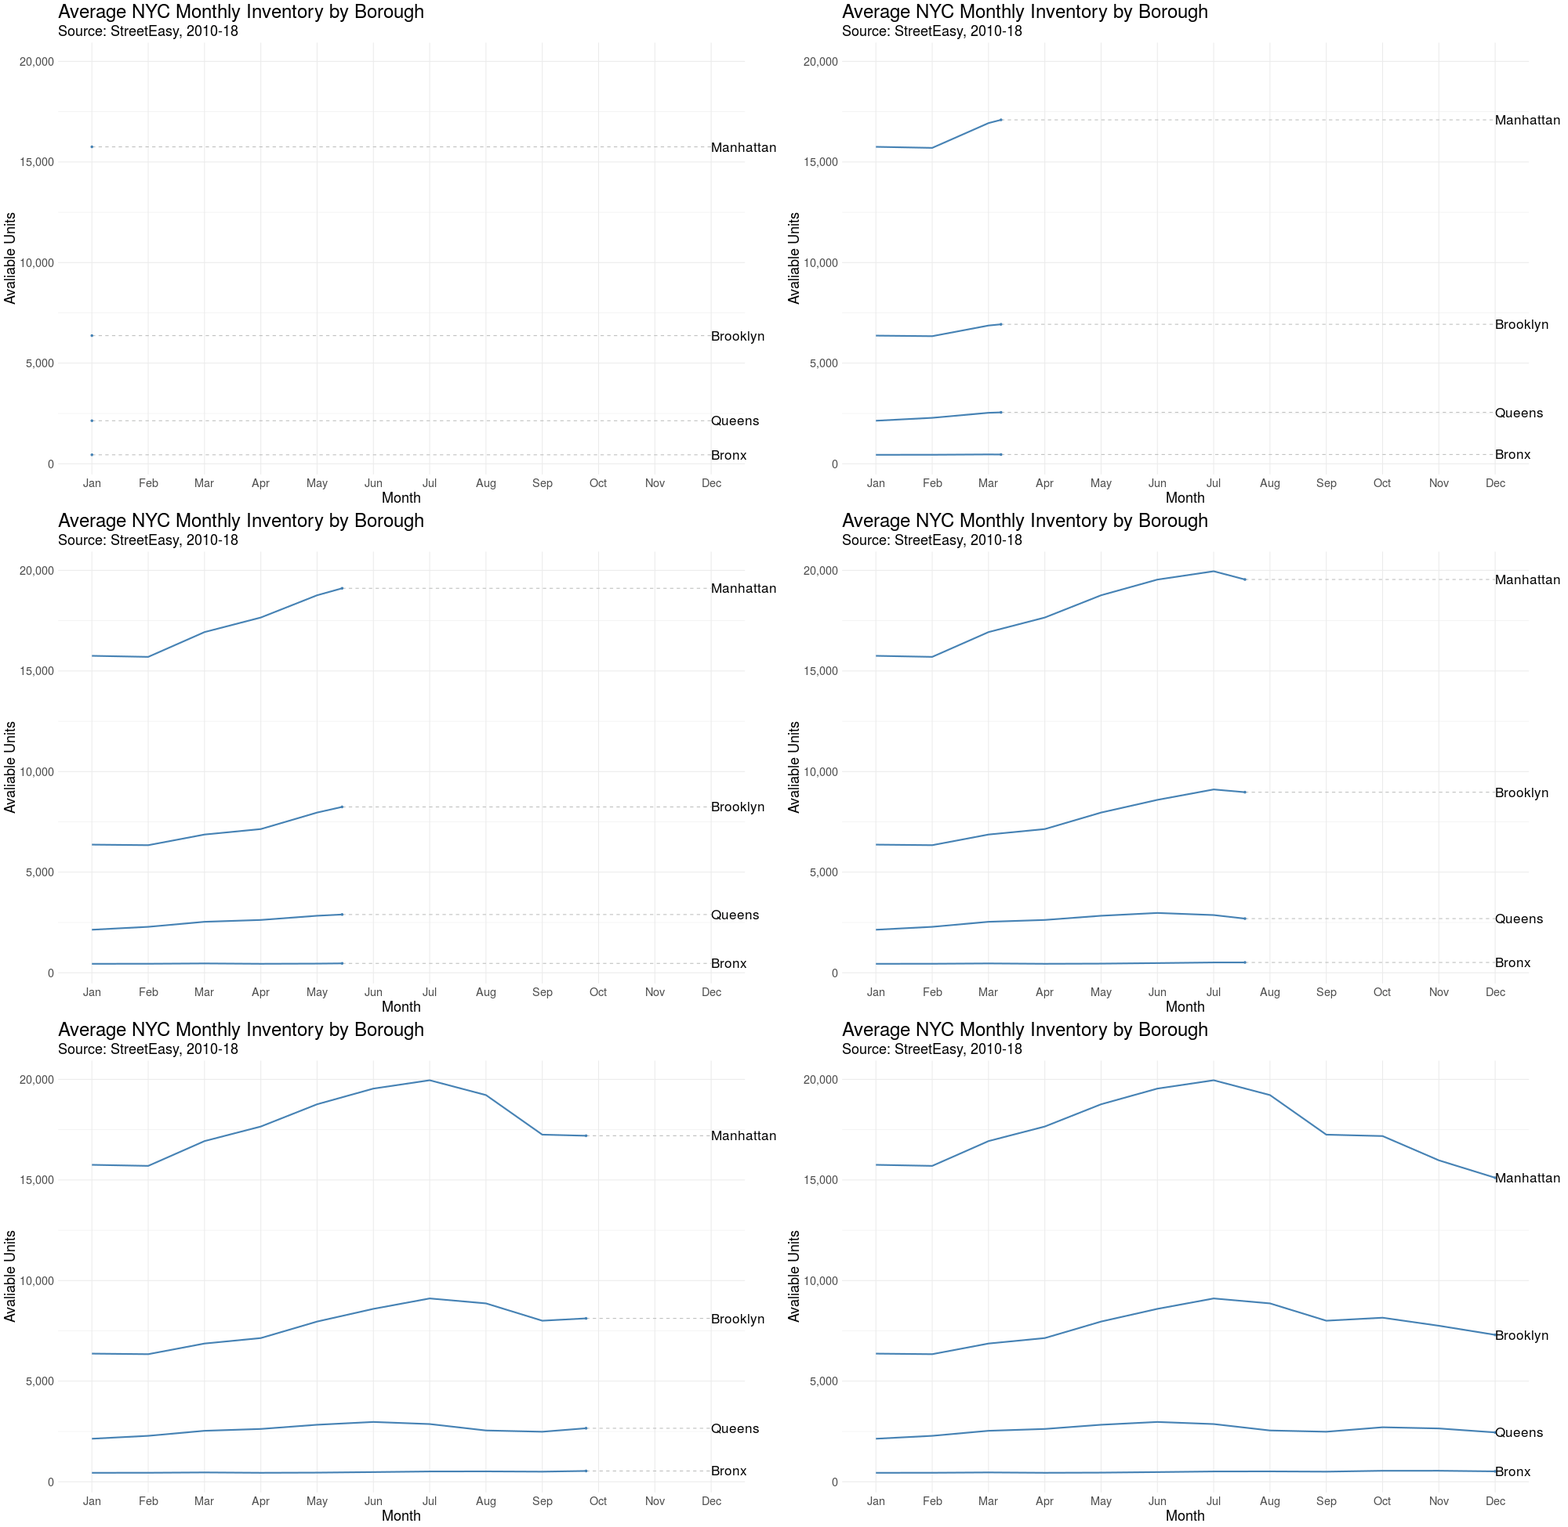
Let’s first visualize the number of rental units on the market over time by borough. This is a monthly view, from January 2010 – December 2018.

Here we see StreetEasy’s growth as marketplace year over year, together with distinct seasonal variation. Let’s explore seasonality next.

Average Rental Inventory by Month

We’d expect some flavor of seasonality with real estate. In the US it’s estimated that 80% of moves occur between April and September. Let’s see if the same pattern is true in NYC.

Sure enough, we observe a “peak season” with an influx of rental units coming onto the market from May to September, although the trend is strongest in Manhattan.

Rental Inventory in Brooklyn’s Neighborhoods

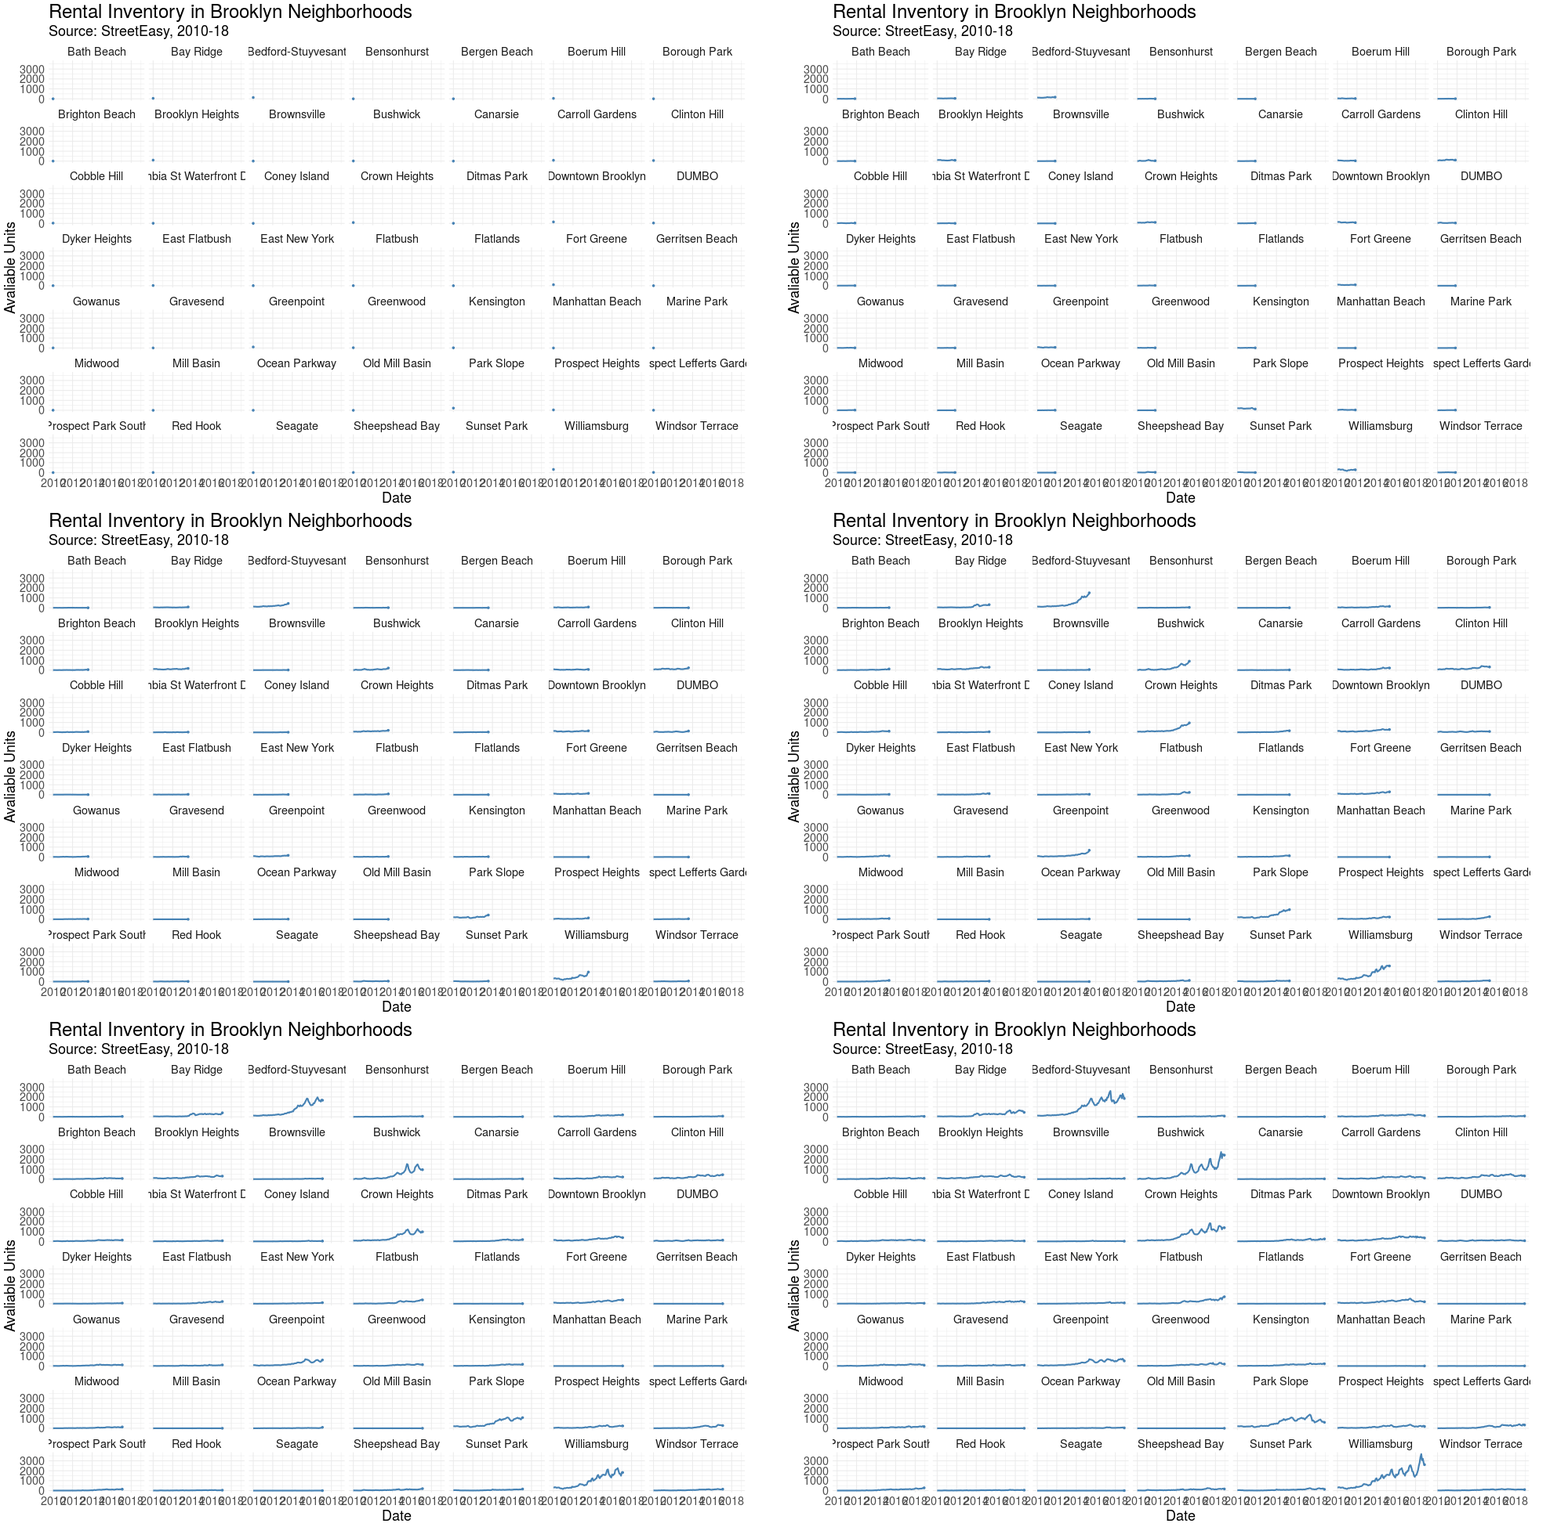
Finally, let’s visualize how housing availability has fluctuated on StreetEasy’s marketplace in each of Brooklyn’s neighborhoods over time.

Using face_wrap from ggplot2, we can easily observe the trend in each neighborhood simultaneously.

Conclusion & Appendix

Kudos to StreetEasy for making this dataset open to the public. There’s certainly more to explore and analyze in their data dashboard. Also, I find gganimate a really useful addition to any data storyteller’s toolkit, and I hope to find more opportunities to leverage this package in the future. Thanks for reading!

R Script: Link
Data Source: Link [Rental Inventory]

Interactive Investment Tool with R Shiny

R Shiny is a fantastic framework to quickly develop and launch interactive data applications. I recently wrote some investing advice and was looking for a way to illustrate two case studies. Building on an RStudio template, I created a tool to visualize the return of an investment over time, allowing the user to modify each parameter and observe its effect:

Click here for the full-page (non-embedded) version.

Find the full code here or below:

library(FinCal)
library(ggplot2)
library(tidyr)
library(shinythemes)
library(scales)

# Define UI for application that draws a histogram
ui <- shinyUI(fluidPage(theme = shinytheme("spacelab"),
  # Application title
  titlePanel("The Potential for Growth: Two Case Studies"),
  p('An interactive tool to accompany the ', a(href = 'https://unboxed-analytics.com/life-hacking/fundamentals-of-investing/', '"Fundamentals of Investing"'), 'post.'),
  
  # Sidebar with a slider input for number of bins
  sidebarLayout(
    sidebarPanel(
      numericInput(
        inputId = "rate",
        label = "Yearly Rate of Return",
        value = .06,
        min = .01,
        max = .15,
        step = .01
      ),
      p("Represented as a decimal."),
      p(".06 = 6%"),
      numericInput(
        inputId = "years",
        label = "Number of Years",
        value = 43,
        min = 3,
        max = 50,
        step = 1
      ),
      numericInput(
        inputId = "pv",
        label = "Initial Outlay",
        value = 2000,
        min = 1000,
        max = 100000,
        step = 1000.
      ),
      numericInput(
        inputId = "pmt",
        label = "Monthly Contribution",
        value = 0,
        min = 0,
        max = 10000,
        step = 100
      ),
      numericInput(
        inputId = "type",
        label = "Payment Type",
        value = 0,
        min = 0,
        max = 1,
        step = 1
      ),
      p("Indicates if payments occur at the end of each period (Payment Type = 0) or if payments occur at the beginning of each period (Payment Type = 1).")
      ),
    
    mainPanel(plotOutput("finPlot"),
              p("The grey line represents PRINCIPAL and the blue line represents PRINCIPAL + INTEREST."),
              p("Case 1: Suppose you have $2,000 to invest. You use that money to purchase a low-cost, tax-efficient, diversified mutual fund offering an approximate yearly return of 6%."),
              p("You purchase the mutual fund on your 22nd birthday and don’t check your account until your 65th birthday on the day of retirement. After 43 years, you would have over $26,200! Your money has doubled four times."),
              p("Case 2: Suppose again you have $2,000 today to invest. You purchase shares of the same mutual and now, in addition to the initial investment, purchase $100 of additional shares each month. [Adjust the 'Monthly Contribution' sidebar parameter]"),
              p("How much would you have at the end of 43 years? Over $268,400! You have passively created wealth through the market."))
  )
))

# Define server logic required to draw a histogram
server <- shinyServer(function(input, output) {
  output$finPlot <- renderPlot({

    # processing
    total <- fv(r = input$rate/12, n = 0:(12*input$years), pv = -input$pv, pmt = -input$pmt, type = input$type)
    principal <- seq(input$pv, input$pv + (input$years*12)*(input$pmt+.000000001), input$pmt + .000000001)
    interest <- total - principal
    df <- data.frame(period = 0:(12*input$years), total, principal)
    
    # plotting
    ggplot(df, aes(x = period)) + 
      geom_line(aes(y = total), col = "blue", size = .85) +
      geom_line(aes(y = principal), col = "black", size = .85) +
      labs(x = "Period",
           y = "") + 
      scale_y_continuous(labels = dollar) +
      theme(legend.position="bottom") +
      theme(legend.title = element_blank()) +
      theme_minimal()
  })
})

# Run the application
shinyApp(ui = ui, server = server)

Analyzing iPhone Usage Data in R

I’m constantly thinking about how to capture and analyze data from day-to-day life. One data source I’ve written about previously is Moment, an iPhone app that tracks screen time and phone pickups. Under the advanced settings, the app offers data export (via JSON file) for nerds like me.

Here we’ll step through a basic analysis of my usage data using R. To replicate this analysis with your own data, fork this code and point the directory to your ‘moment.json’ file.

Cleaning + Feature Engineering

We’ll start by calling the “rjson” library and bringing in the JSON file.

library("rjson")
json_file = "/Users/erikgregorywebb/Downloads/moment.json"
json_data <- fromJSON(file=json_file)

Because of the structure of the file, we need to “unlist” each day and then combine them into a single data frame. We’ll then add column names and ensure the variables are of the correct data type and format.

df <- lapply(json_data, function(days) # Loop through each "day"
{data.frame(matrix(unlist(days), ncol=3, byrow=T))})

# Connect the list of dataframes together in one single dataframe
moment <- do.call(rbind, df)

# Add column names, remove row names
colnames(moment) <- c("minuteCount", "pickupCount", "Date")
rownames(moment) <- NULL

# Correctly format variables
moment$minuteCount <- as.numeric(as.character(moment$minuteCount))
moment$pickupCount <- as.numeric(as.character(moment$pickupCount))
moment$Date <- substr(moment$Date, 0, 10)
moment$Date <- as.Date(moment$Date, "%Y-%m-%d")

Let’s create a feature to enrich our analysis later on. A base function in R called “weekdays” quickly extracts the weekday, month or quarter of a date object.

moment$DOW <- weekdays(moment$Date)
moment$DOW <- as.factor(moment$DOW)

With the data cleaning and feature engineering complete, the data frame looks like this:

Minute CountPickup CountDateDOW
131542018-06-16Saturday
53462018-06-15Friday
195642018-06-14Thursday
91522018-06-13Wednesday

For clarity, the minute count refers to the number of minutes of “screen time.” If the screen is off, Moment doesn’t count listening to music or talking on the phone. What about a pickup? Moment’s FAQs define a pickup as each separate time you turn on your phone screen. For example, if you pull your phone out of your pocket, respond to a text, then put it back, that counts as one pickup.

With those feature definitions clarified, let’s move to the fun part: visualization and modeling!

Visualization

I think good questions bring out the best visualizations so let’s start by thinking of some questions we can answer about my iPhone usage:

  1. What do the distributions of minutes and pickups look like?
  2. How does the number of minutes and pickups trend over time?
  3. What’s the relationship between minutes and pickups?
  4. Does the average number of minutes and pickups vary by weekday?

Let’s start with the first question, arranging the two distributions side by side.

g1 <- ggplot(moment, aes(x = minuteCount)) +
  geom_density(alpha=.2, fill="blue") +
  labs(title = "Screen Time Minutes",
       x = "Minutes",
       y = "Density") +
  theme_minimal() + 
  theme(plot.title = element_text(hjust = 0.5))

g2 <- ggplot(moment, aes(x = pickupCount)) +
  geom_density(alpha=.2, fill="red") +
  labs(title = "Phone Pickups",
       x = "Pickups",
       y = "Density") +
  theme_minimal() + 
  theme(plot.title = element_text(hjust = 0.5))

grid.arrange(g1, g2, ncol=2)

On average, it looks like I spend about 120 minutes (2 hours) on my phone with about 50 pickups. Check out that screen time minutes outlier; I can’t remember spending 500+ minutes (8 hours) on my phone!

Next, how does my usage trend over time?

g4 <- ggplot(moment, aes(x = Date, y = minuteCount)) +
  geom_line() +
  geom_smooth(se = FALSE) +
  labs(title = "Screen Minutes Over Time ",
       x = "Date",
       y = "Minutes") +
  theme_minimal() +
  theme(plot.title = element_text(hjust = 0.5))

g5 <- ggplot(moment, aes(x = Date, y = pickupCount)) +
  geom_line() +
  geom_smooth(se = FALSE) +
  labs(title = "Phone Pickups Over Time ",
       x = "Date",
       y = "Pickups") +
  theme_minimal() +
  theme(plot.title = element_text(hjust = 0.5))

grid.arrange(g4, g5, nrow=2)

Screen time appears fairly constant over time but there’s an upward trend in the number of pickups starting in late March. Let’s remove some of the noise and plot these two metrics by month.

moment$monyr <- as.factor(paste(format(moment$Date, "%Y"), format(moment$Date, "%m"), "01", sep = "-"))

bymonth <- moment %>%
  group_by(monyr) %>%
  summarise(avg_minute = mean(minuteCount),
            avg_pickup = mean(pickupCount)) %>%
  filter(avg_minute > 50) %>% # used to remove the outlier for July 2017
  arrange(monyr)

bymonth$monyr <- as.Date(as.character(bymonth$monyr), "%Y-%m-%d")
g7 <- ggplot(bymonth, aes(x = monyr, y = avg_minute)) + 
  geom_line(col = "grey") + 
  geom_smooth(se = FALSE) + 
  ylim(90, 170) + 
  labs(title = "Average Screen Time by Month",
       x = "Date",
       y = "Minutes") +
  theme_minimal() +
  theme(plot.title = element_text(hjust = 0.5))

g8 <- ggplot(bymonth, aes(x = monyr, y = avg_pickup)) + 
  geom_line(col = "grey") + 
  geom_smooth(se = FALSE) + 
  ylim(30, 70) + 
  labs(title = "Average Phone Pickups by Month",
       x = "Date",
       y = "Pickups") +
  theme_minimal() +
  theme(plot.title = element_text(hjust = 0.5))

grid.arrange(g7, g8, nrow=2)
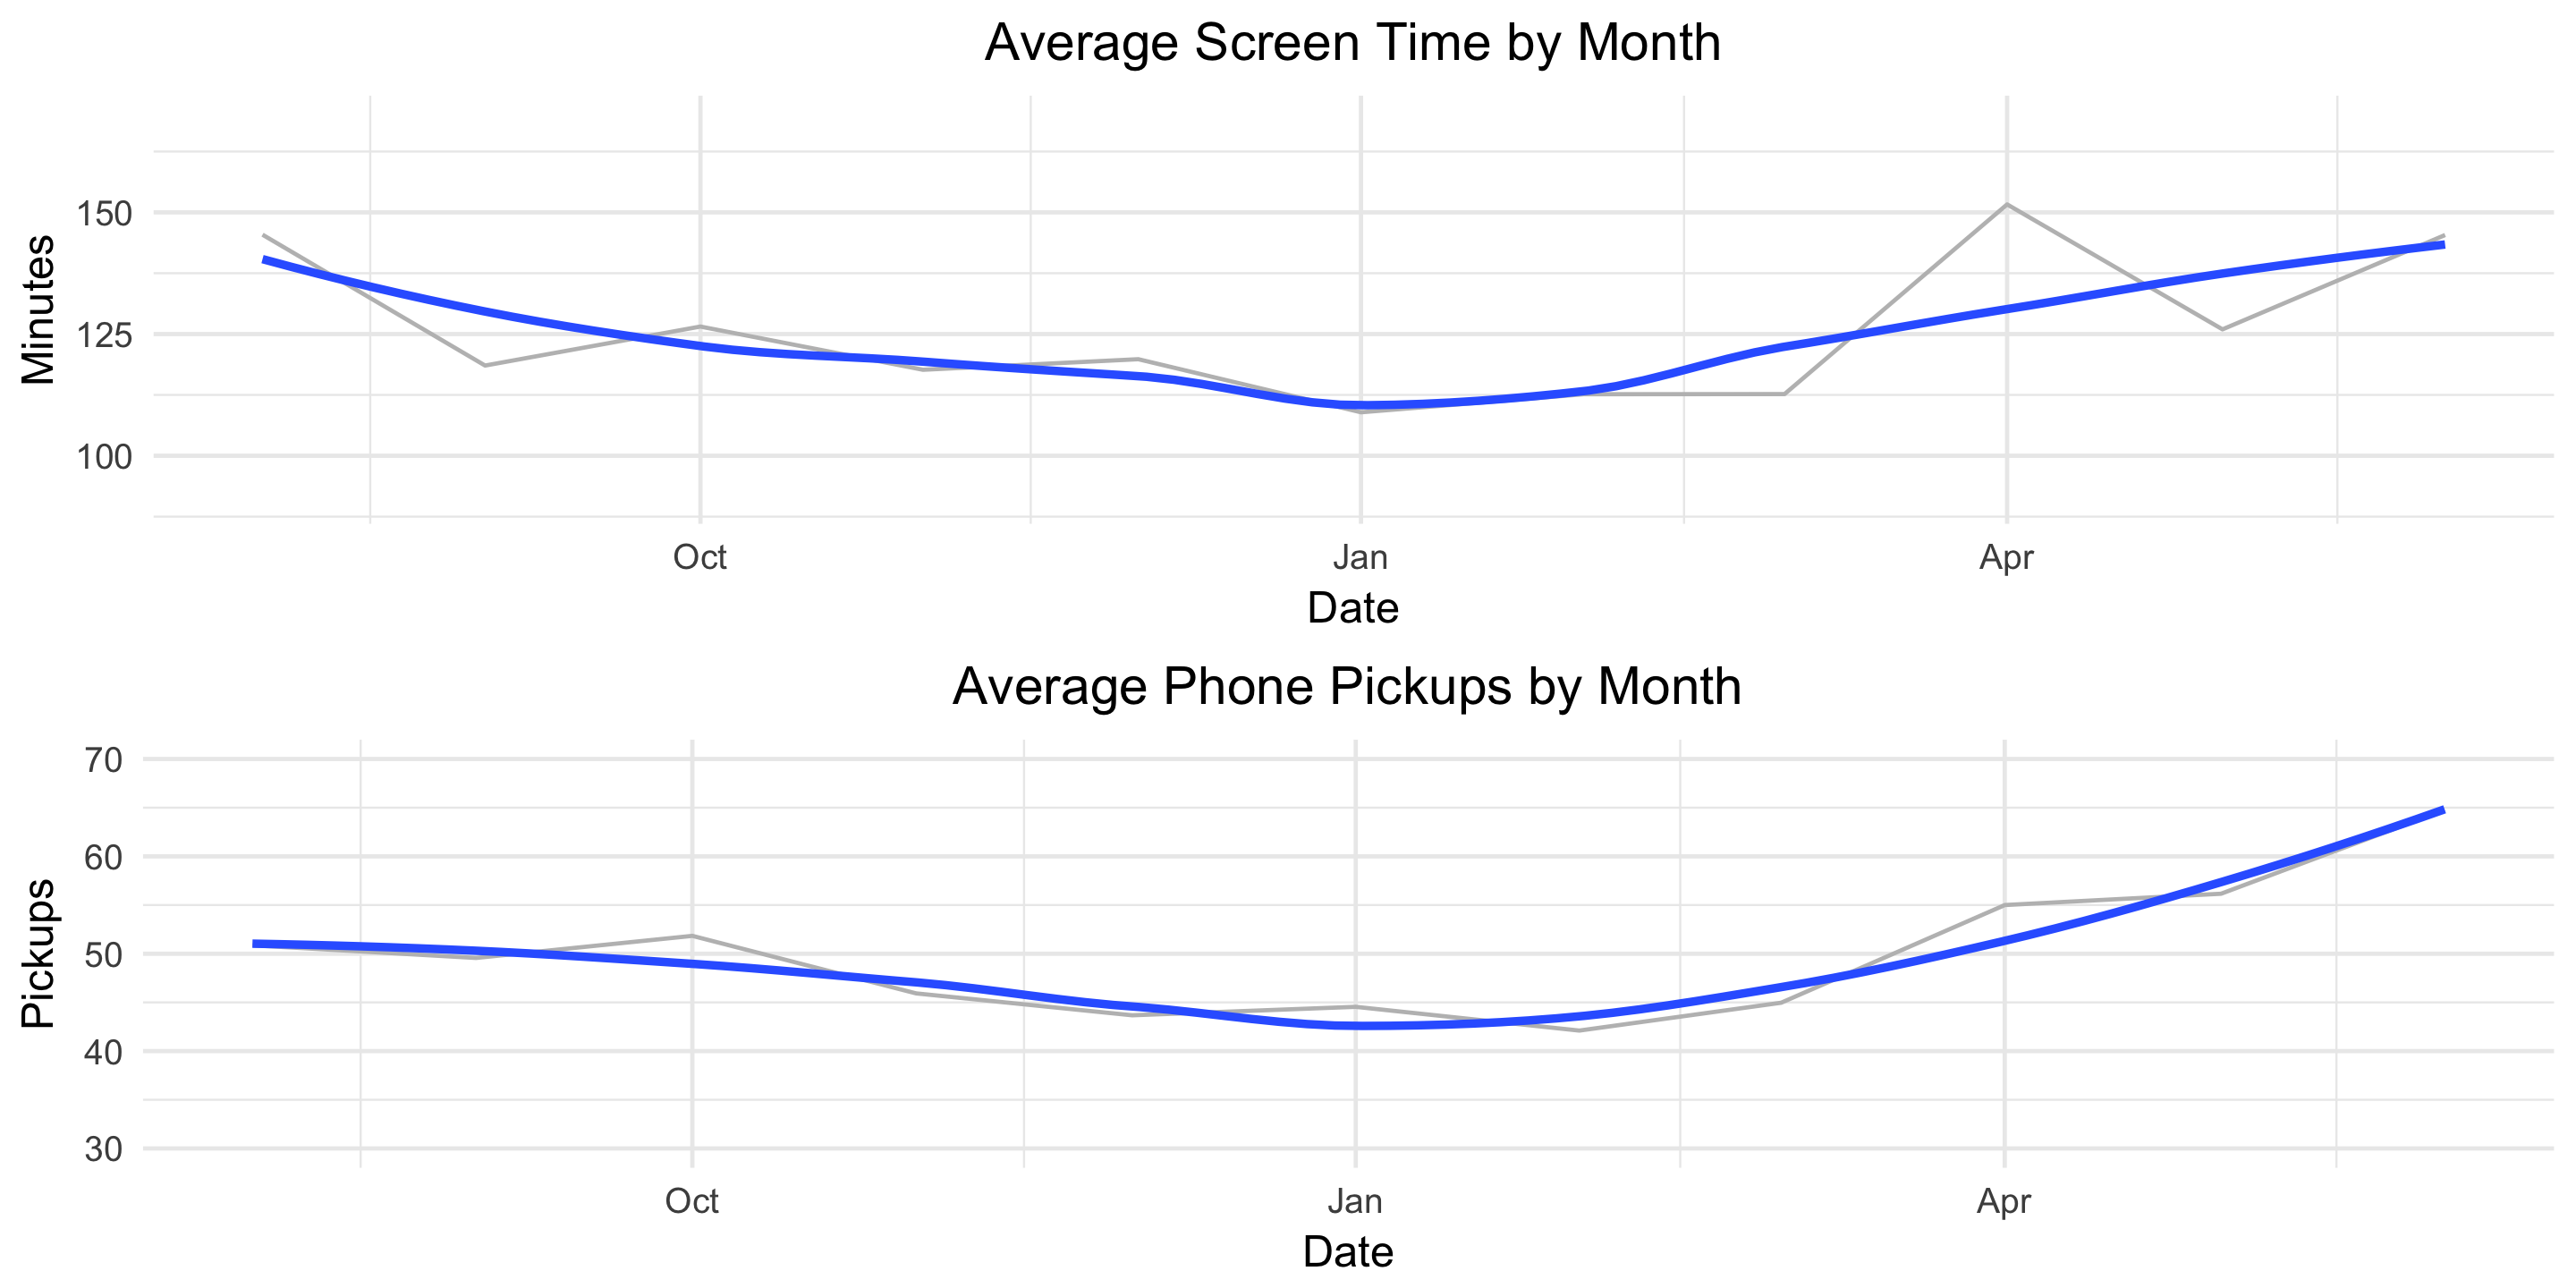
This helps the true pattern emerge. The average values are plotted in light grey and overlayed with a blue, smoothed line. Here we see a clear decline in both screen-time minutes and pickups from August until January and then a clear increase from January until June.

Finally, let’s see how our usage metrics vary by day of the week. We might suspect some variation since my weekday and weekend schedules are different.

byDOW <- moment %>%
  group_by(DOW) %>%
  summarise(avg_minute = mean(minuteCount),
            avg_pickup = mean(pickupCount)) %>%
  arrange(desc(avg_minute))

g10 <- ggplot(byDOW, aes(x = reorder(DOW, -avg_minute), y = avg_minute)) + 
  geom_bar(stat = "identity", alpha = .4, fill = "blue", colour="black") +
  labs(title = "Average Screen Time by DOW",
       x = "",
       y = "Minutes") +
  theme_minimal() +
  theme(plot.title = element_text(hjust = 0.5))

g11 <- ggplot(byDOW, aes(x = reorder(DOW, -avg_pickup), y = avg_pickup)) + 
  geom_bar(stat = "identity", alpha = .4, fill = "red", colour="black") +
  labs(title = "Average Phone Pickups by DOW",
       x = "",
       y = " Pickups") +
  theme_minimal() +
  theme(plot.title = element_text(hjust = 0.5))

grid.arrange(g10, g11, ncol=2)
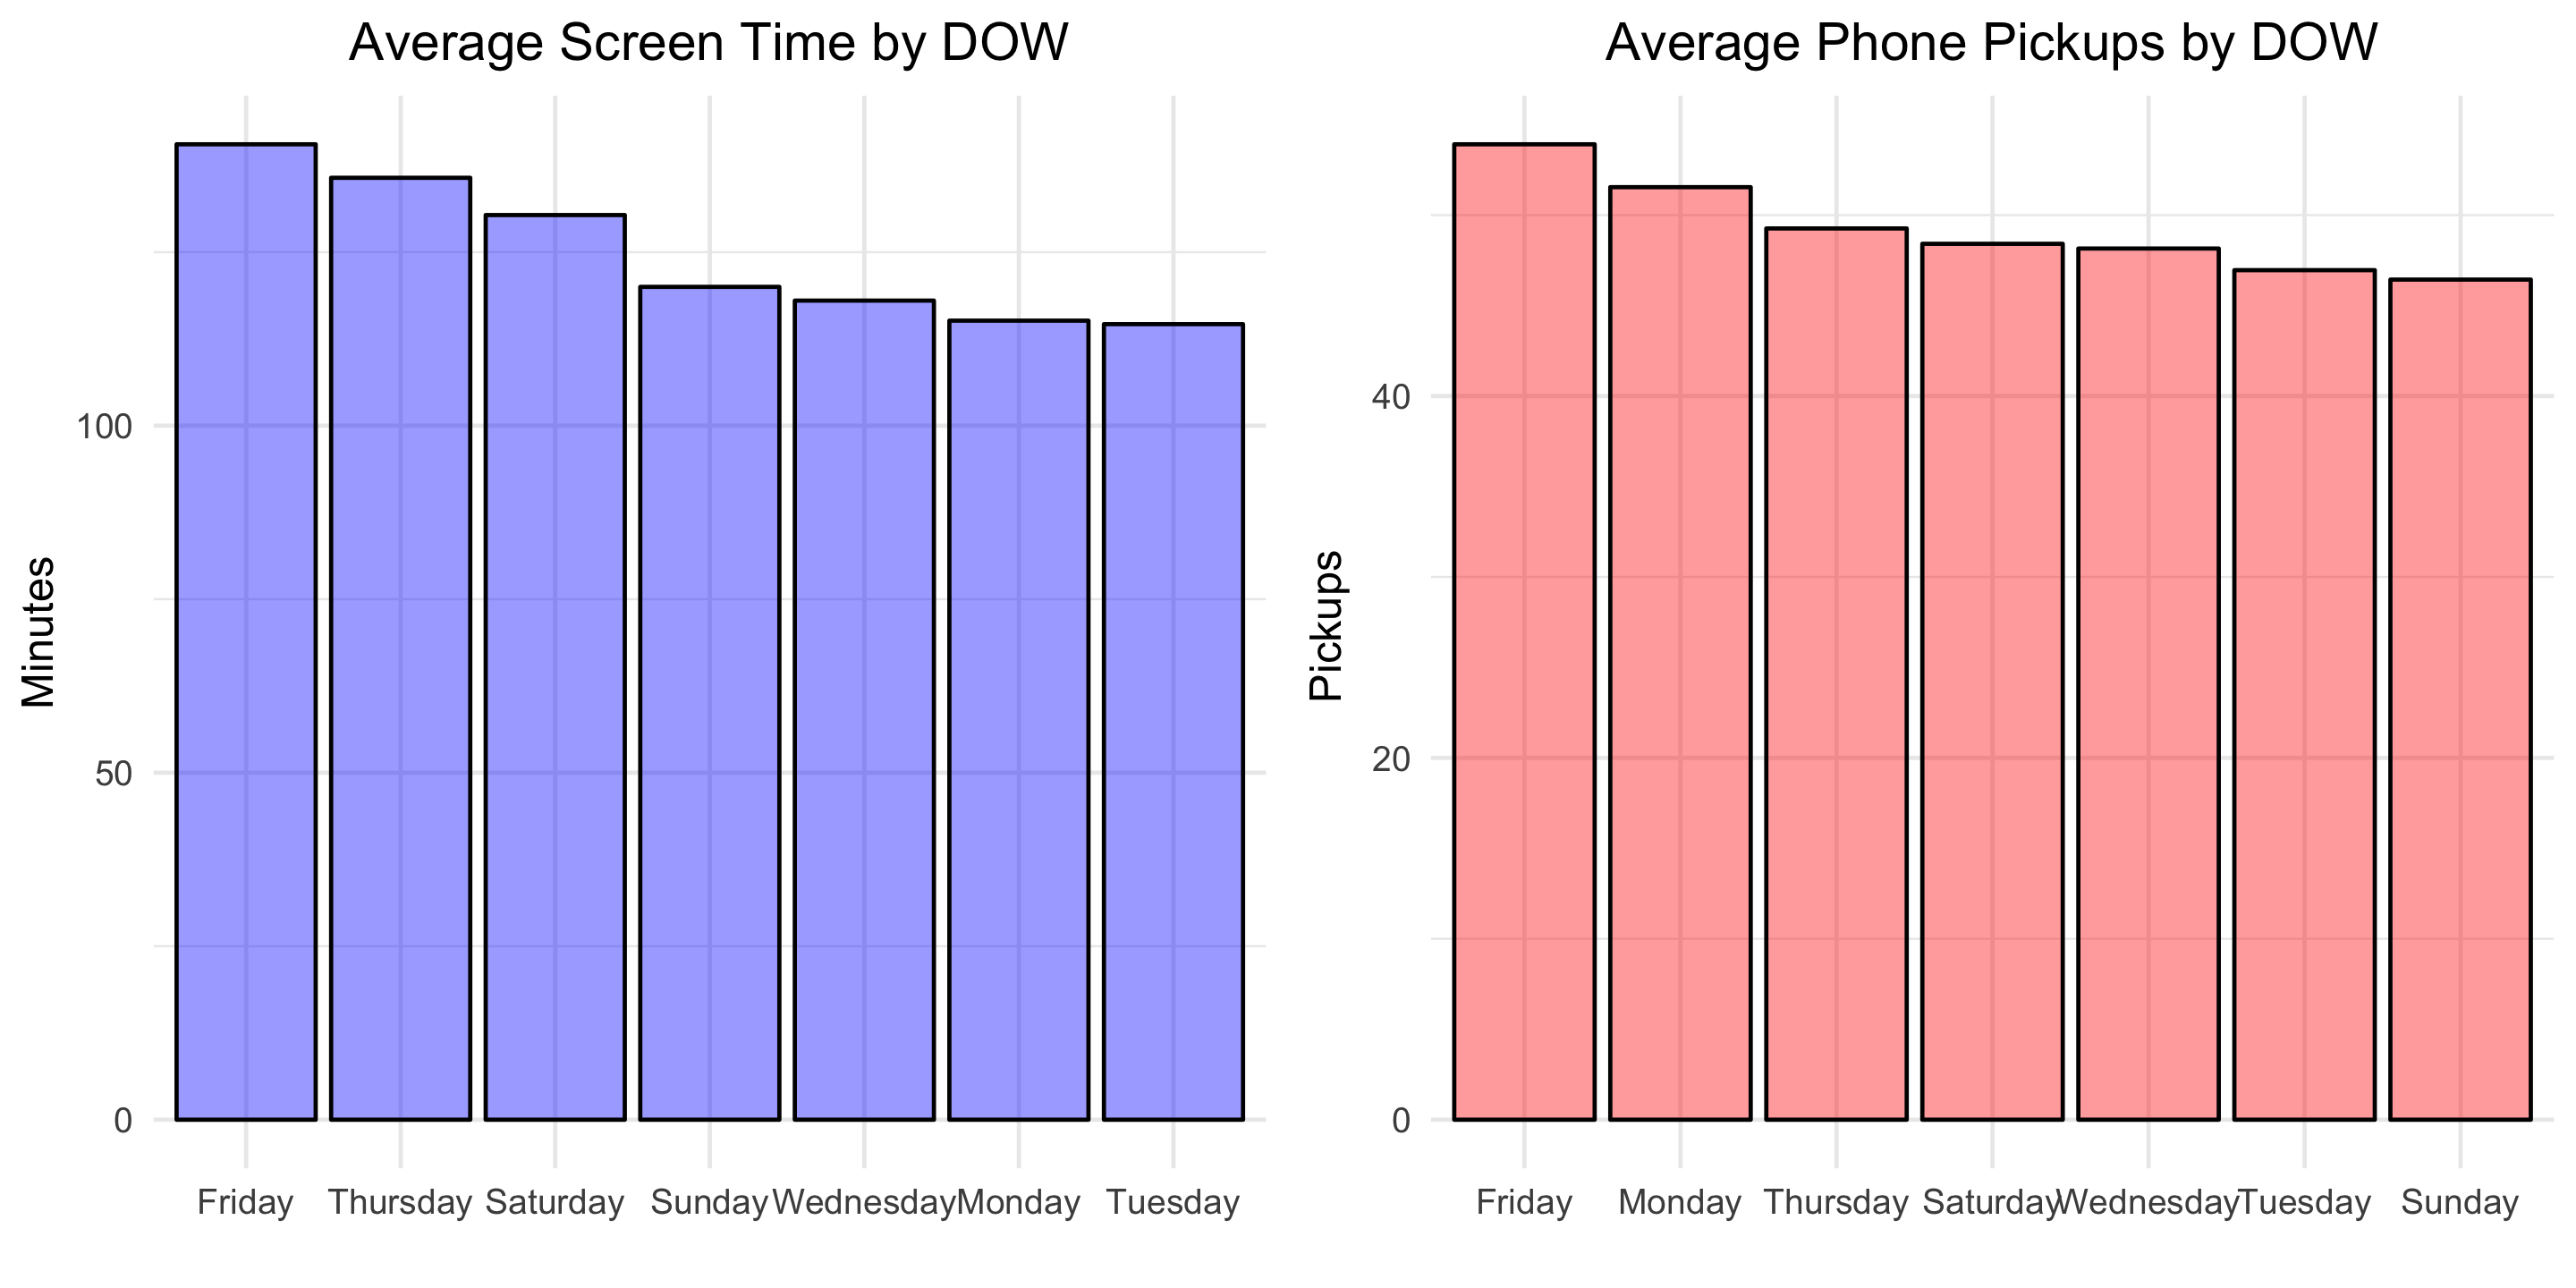
Looks like self-control slips in preparation for the weekend! Friday is the day with the greatest average screen time and average phone pickups.

Modeling

To finish, let’s fit a basic linear model to explore the relationship between phone pickups and screen-time minutes.

fit <- lm(minuteCount ~ pickupCount, data = moment)
summary(fit)

Below is the output:

Coefficients:
            Estimate Std. Error t value Pr(>|t|)    
(Intercept)  39.9676     9.4060   4.249 2.82e-05 ***
pickupCount   1.7252     0.1824   9.457  < 2e-16 ***
---
Signif. codes:  0 ‘***’ 0.001 ‘**’ 0.01 ‘*’ 0.05 ‘.’ 0.1 ‘ ’ 1

Residual standard error: 50.07 on 320 degrees of freedom
Multiple R-squared:  0.2184,	Adjusted R-squared:  0.216 
F-statistic: 89.43 on 1 and 320 DF,  p-value: < 2.2e-16

This means that, on average, each additional phone pickup results in 1.7 minutes of screen time. Let’s visualize the model fit.

g13 <- ggplot(moment, aes(x = pickupCount, y = minuteCount)) + 
  geom_point(alpha = .6) + 
  geom_smooth(method = 'lm', formula = y ~ x, se = FALSE) +
  #geom_bar(stat = "identity", alpha = .4, fill = "blue", colour="black") +
  labs(title = "Minutes of Screen Time vs Phone Pickups",
       x = "Phone Pickups",
       y = "Minutes of Screen Time") +
  theme_minimal() +
  theme(plot.title = element_text(hjust = 0.5))

You can find all the code used in this post here. Download your own Moment data, point the R script towards the file, and Voila, two dashboard-type images like the one below will be produced for your personal enjoyment.

What other questions would you answer?
css.php