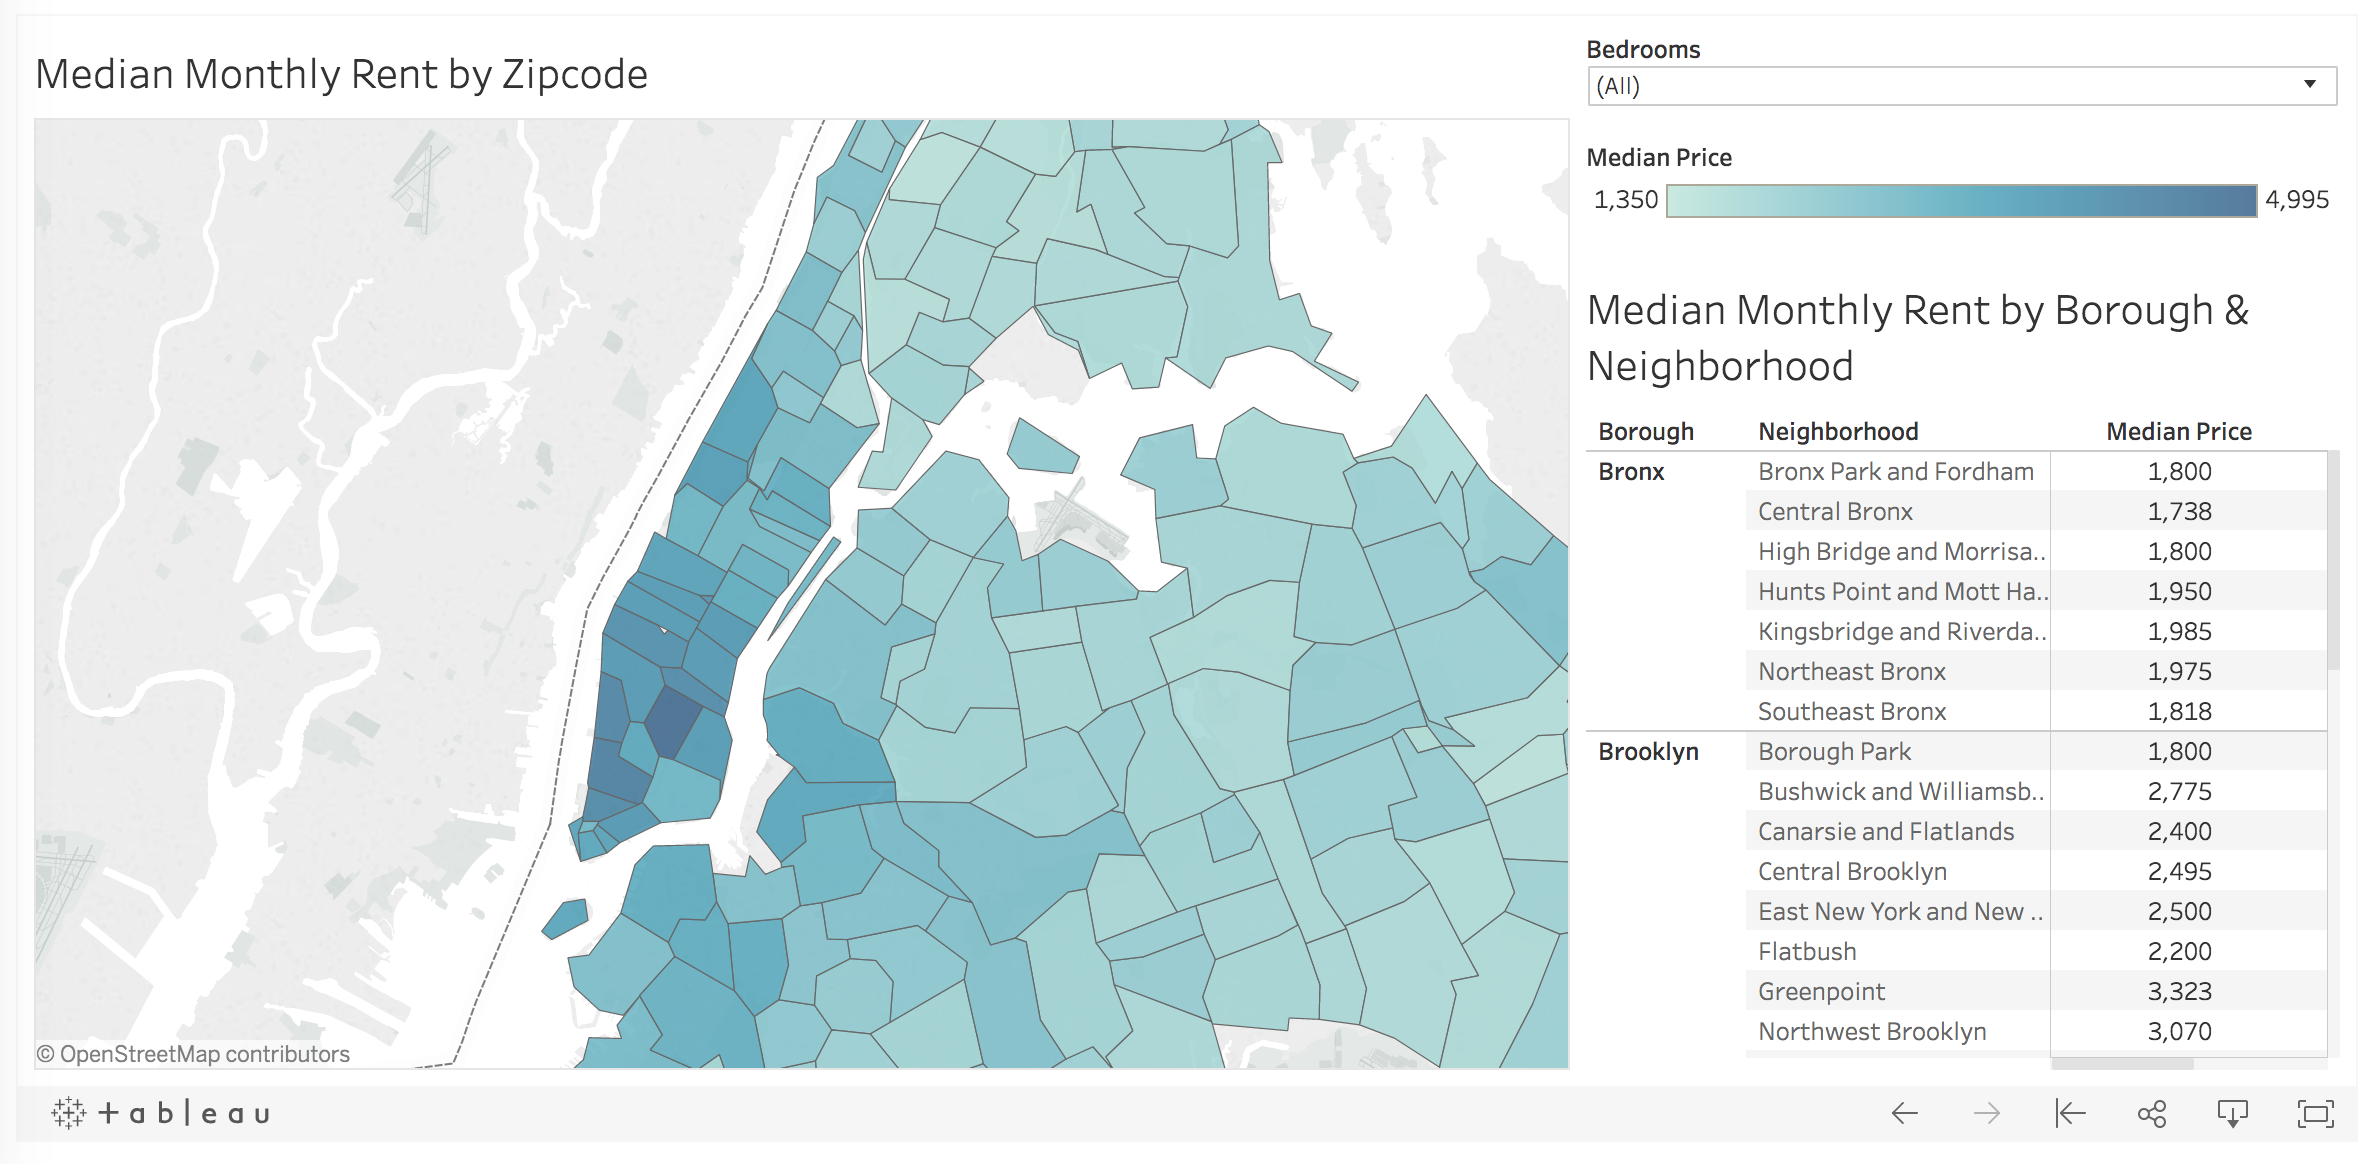
This summer my wife and I relocated to New York City in preparation for the start of my new job. Housing in Manhattan and the surrounding boroughs is notoriously expensive, so I decided to pursue a data-driven approach to our apartment search. I wrote a Python script to scrape 9,000+ apartment listings on Craigslist for zip codes in the five boroughs: Manhattan, Bronx, Brooklyn, Queens, and Staten Island. I then visualized the median rent by zip code in Tablaeu. Check out the dashboard here!
Gathering the Data
Before digging into some housing insights, let’s walk through the process used to obtain the data. First, I obtained data about the organization of New York City’s boroughs, neighborhoods, and zip codes from a New York State Department of Health website. I then leveraged the structure of Craigslists’s URLs to construct a vector of links to search for apartments in each of the zip codes. Here’s what the URL to search for apartments with the zip code 10453 looks like:
https://newyork.craigslist.org/search/aap?postal=10453
Let’s see what that looks like in code.
The ‘nyc-zip-codes.csv’ file referenced above can be found here. Next, I wrote a function to extract the pertinent information from each listing from each of these links. I extracted the listing title, posting date, monthly rent, and the number of bedrooms, when available.
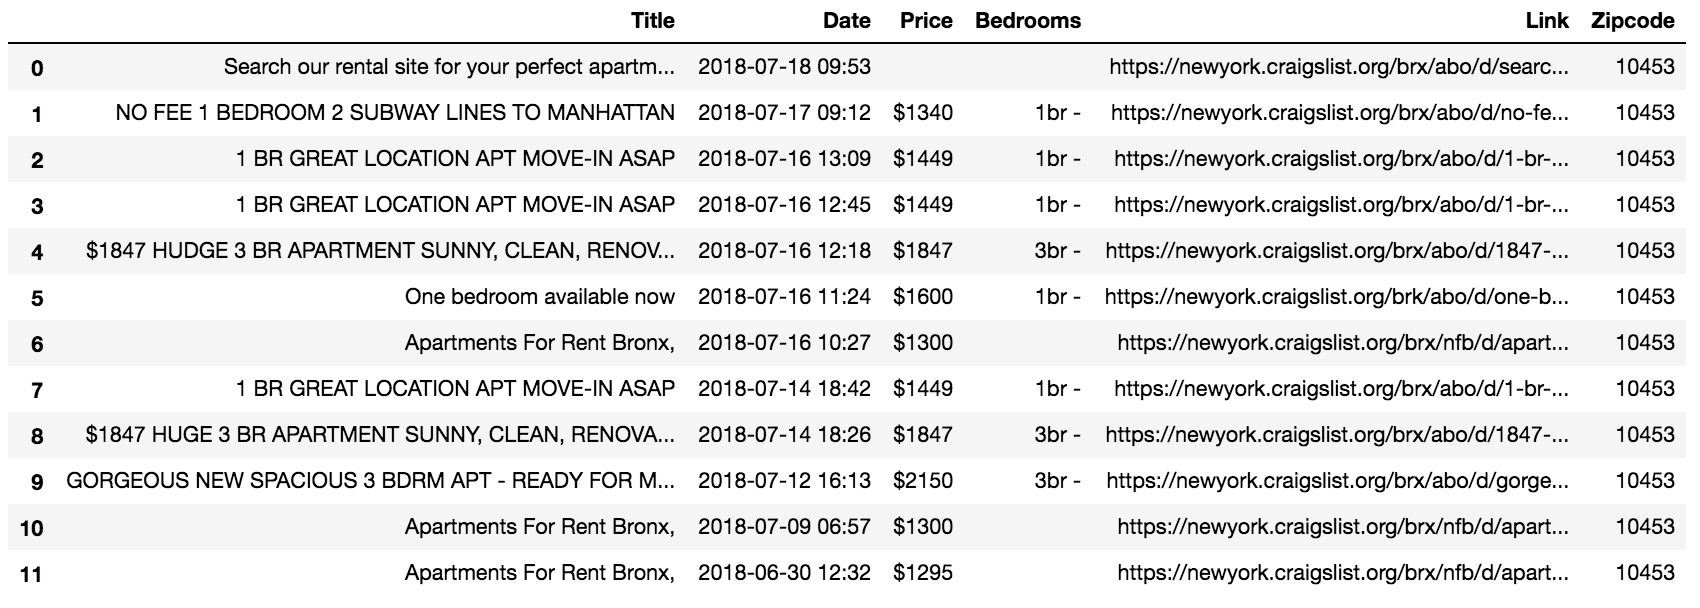
This is what the function returns when fed the sample link for zip code 10453.
At this point, we just need a way to loop through each zip code and compile the data the function returns.
After cleaning the data and removing duplicates, we have about 9,400 listings to work with.
Analyzing the Data
Let’s start with the big picture and then zoom in. Below we have the median rental price of listings by borough. Manhattan is by far the most expensive place to live, followed in distant second by Brooklyn. Queens, Staten Island, and the Bronx are actually somewhat comparable, with median rent in Queens only $250 higher than median rent in the Bronx.
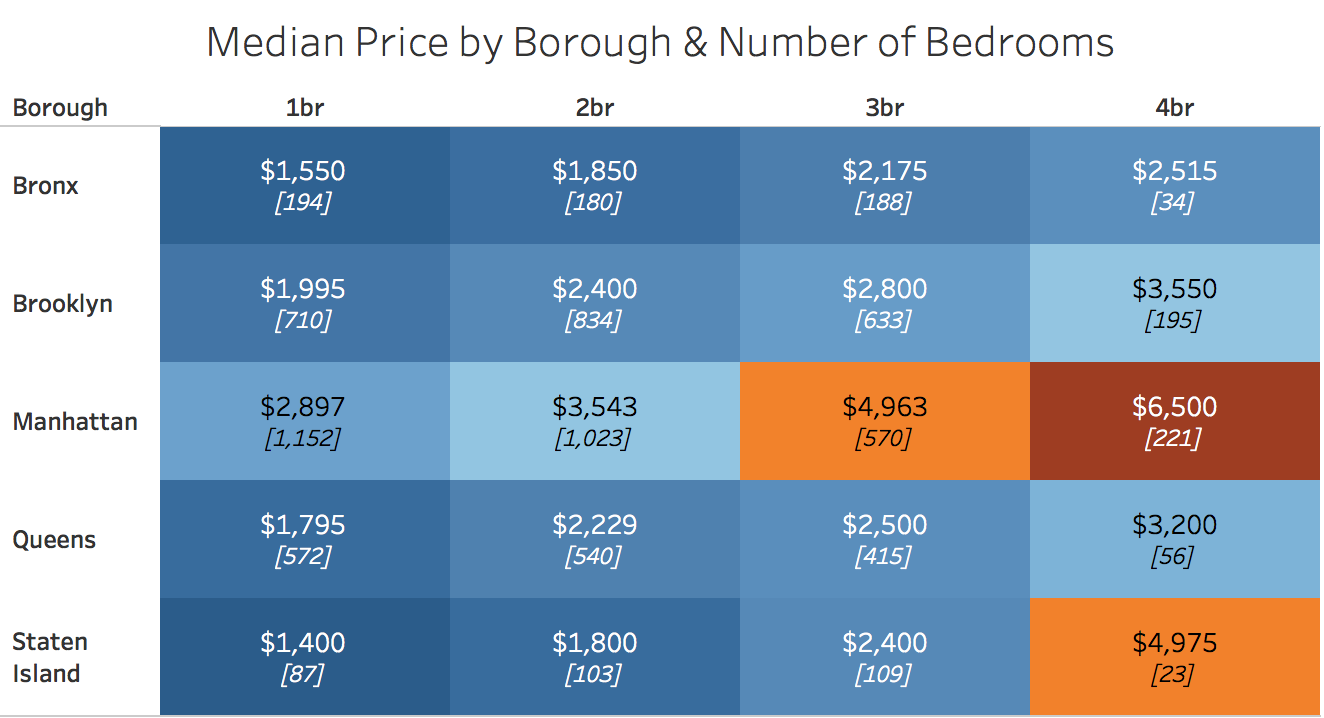
How does rent vary in the five boroughs by the number of bedrooms the unit has? Filtering the data to include only units with 1 to 4 bedrooms, Manhattan is still the most expensive for each number of bedrooms.
Note that the bracketed, italicized numbers above show the number of listings for each borough and bedroom combination.
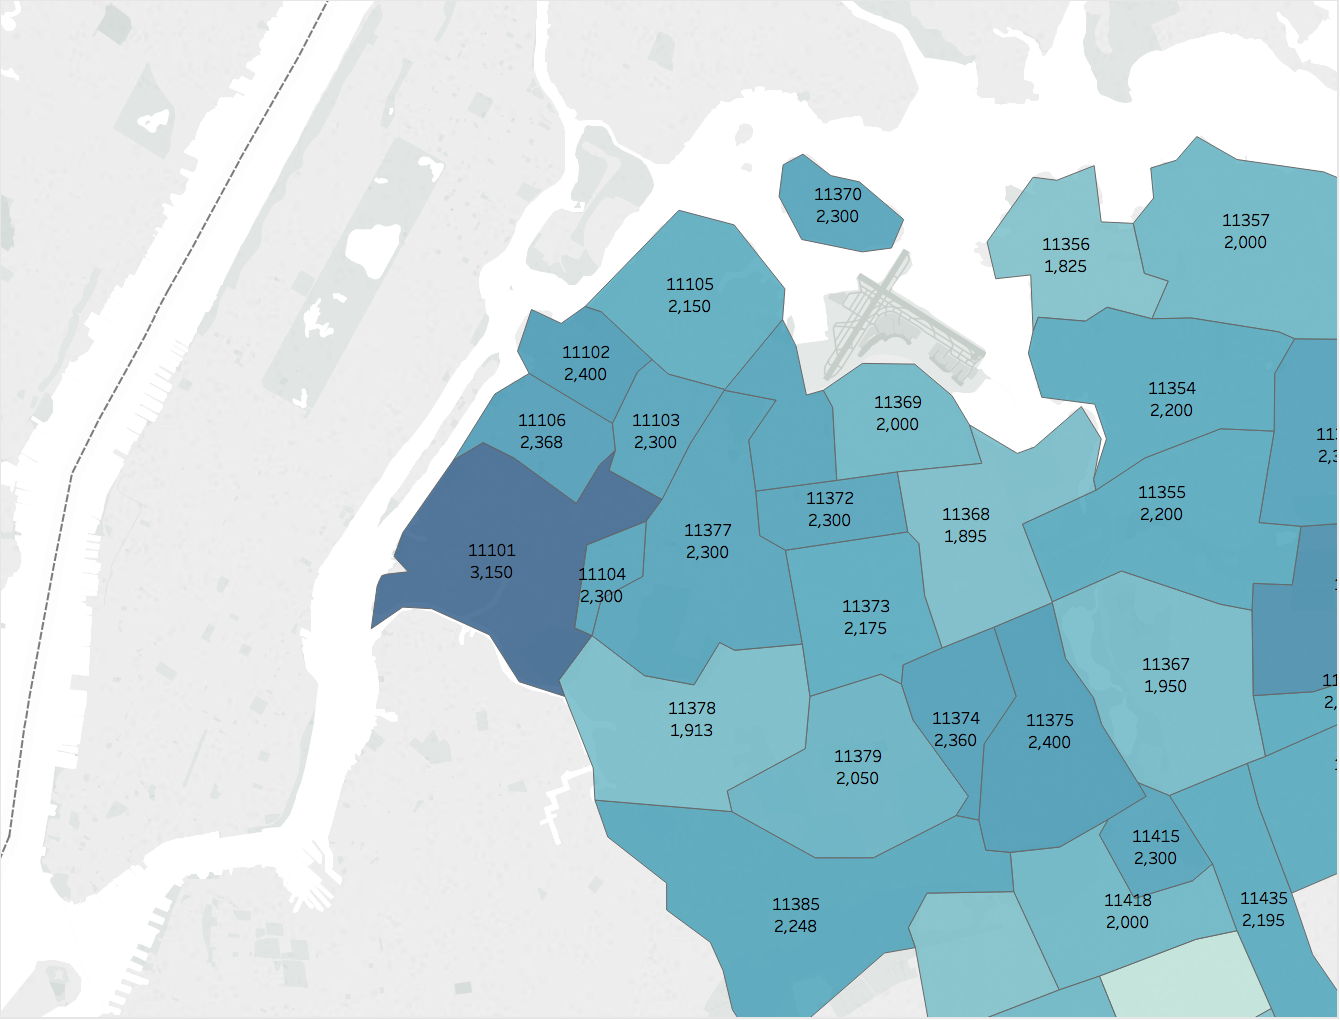
My wife and I had hoped to find a 2-bedroom apartment in a safe neighborhood with a 30-minute commute to Midtown for $2,000 or less. But, as you can see in the image below depicting median 2-bedroom rent by zip code in Queens, that may be a tough find!
Now, what else would I have liked to add to this analysis? Since one major consideration in the hunt for housing is commute time, how about a distance-adjusted median rental price metric for each zip code? This is something I’ll tackle in a future post.
Conclusion
Ultimately, my wife and I found housing in Scarsdale through a family friend and didn’t end up living in any of the five boroughs! Luckily, by feeding the script a different set of zip codes and modifying the Craigslist URL structure, I’ll be able to replicate this data-driven process in future apartment searches.
Find the complete code here, hosted as a Gist on GitHub.
Check out my other data projects here.

