
Like many people, my wife and I relax by watching a show before going to bed at the end of the day. My preference is light-hearted comedy that doesn’t require much brainpower. Not surprisingly, frequent picks include episodes from sitcoms like The Office and Community.
Curious to see how well-liked some of my favorite shows were in their time, I scrapped 818 episode ratings and descriptions from IMDb.com for my top shows: The Office, Parks & Recreation, Modern Family, Community, New Girl, and The Good Place. I used IMDb’s crowd-sourced episode ratings to plot popularity across seasons, and extracted character name counts from episode descriptions to loosely quantify character importance.

Rating Trends
IMDb lists five data elements for each episode: name, release date, average rating, number of votes, and description:

Looking for high-level rating trends, I plotted all 800+ episode ratings by release date for all six shows in a single chart, with an overlaid bold line to emphasize the trend.
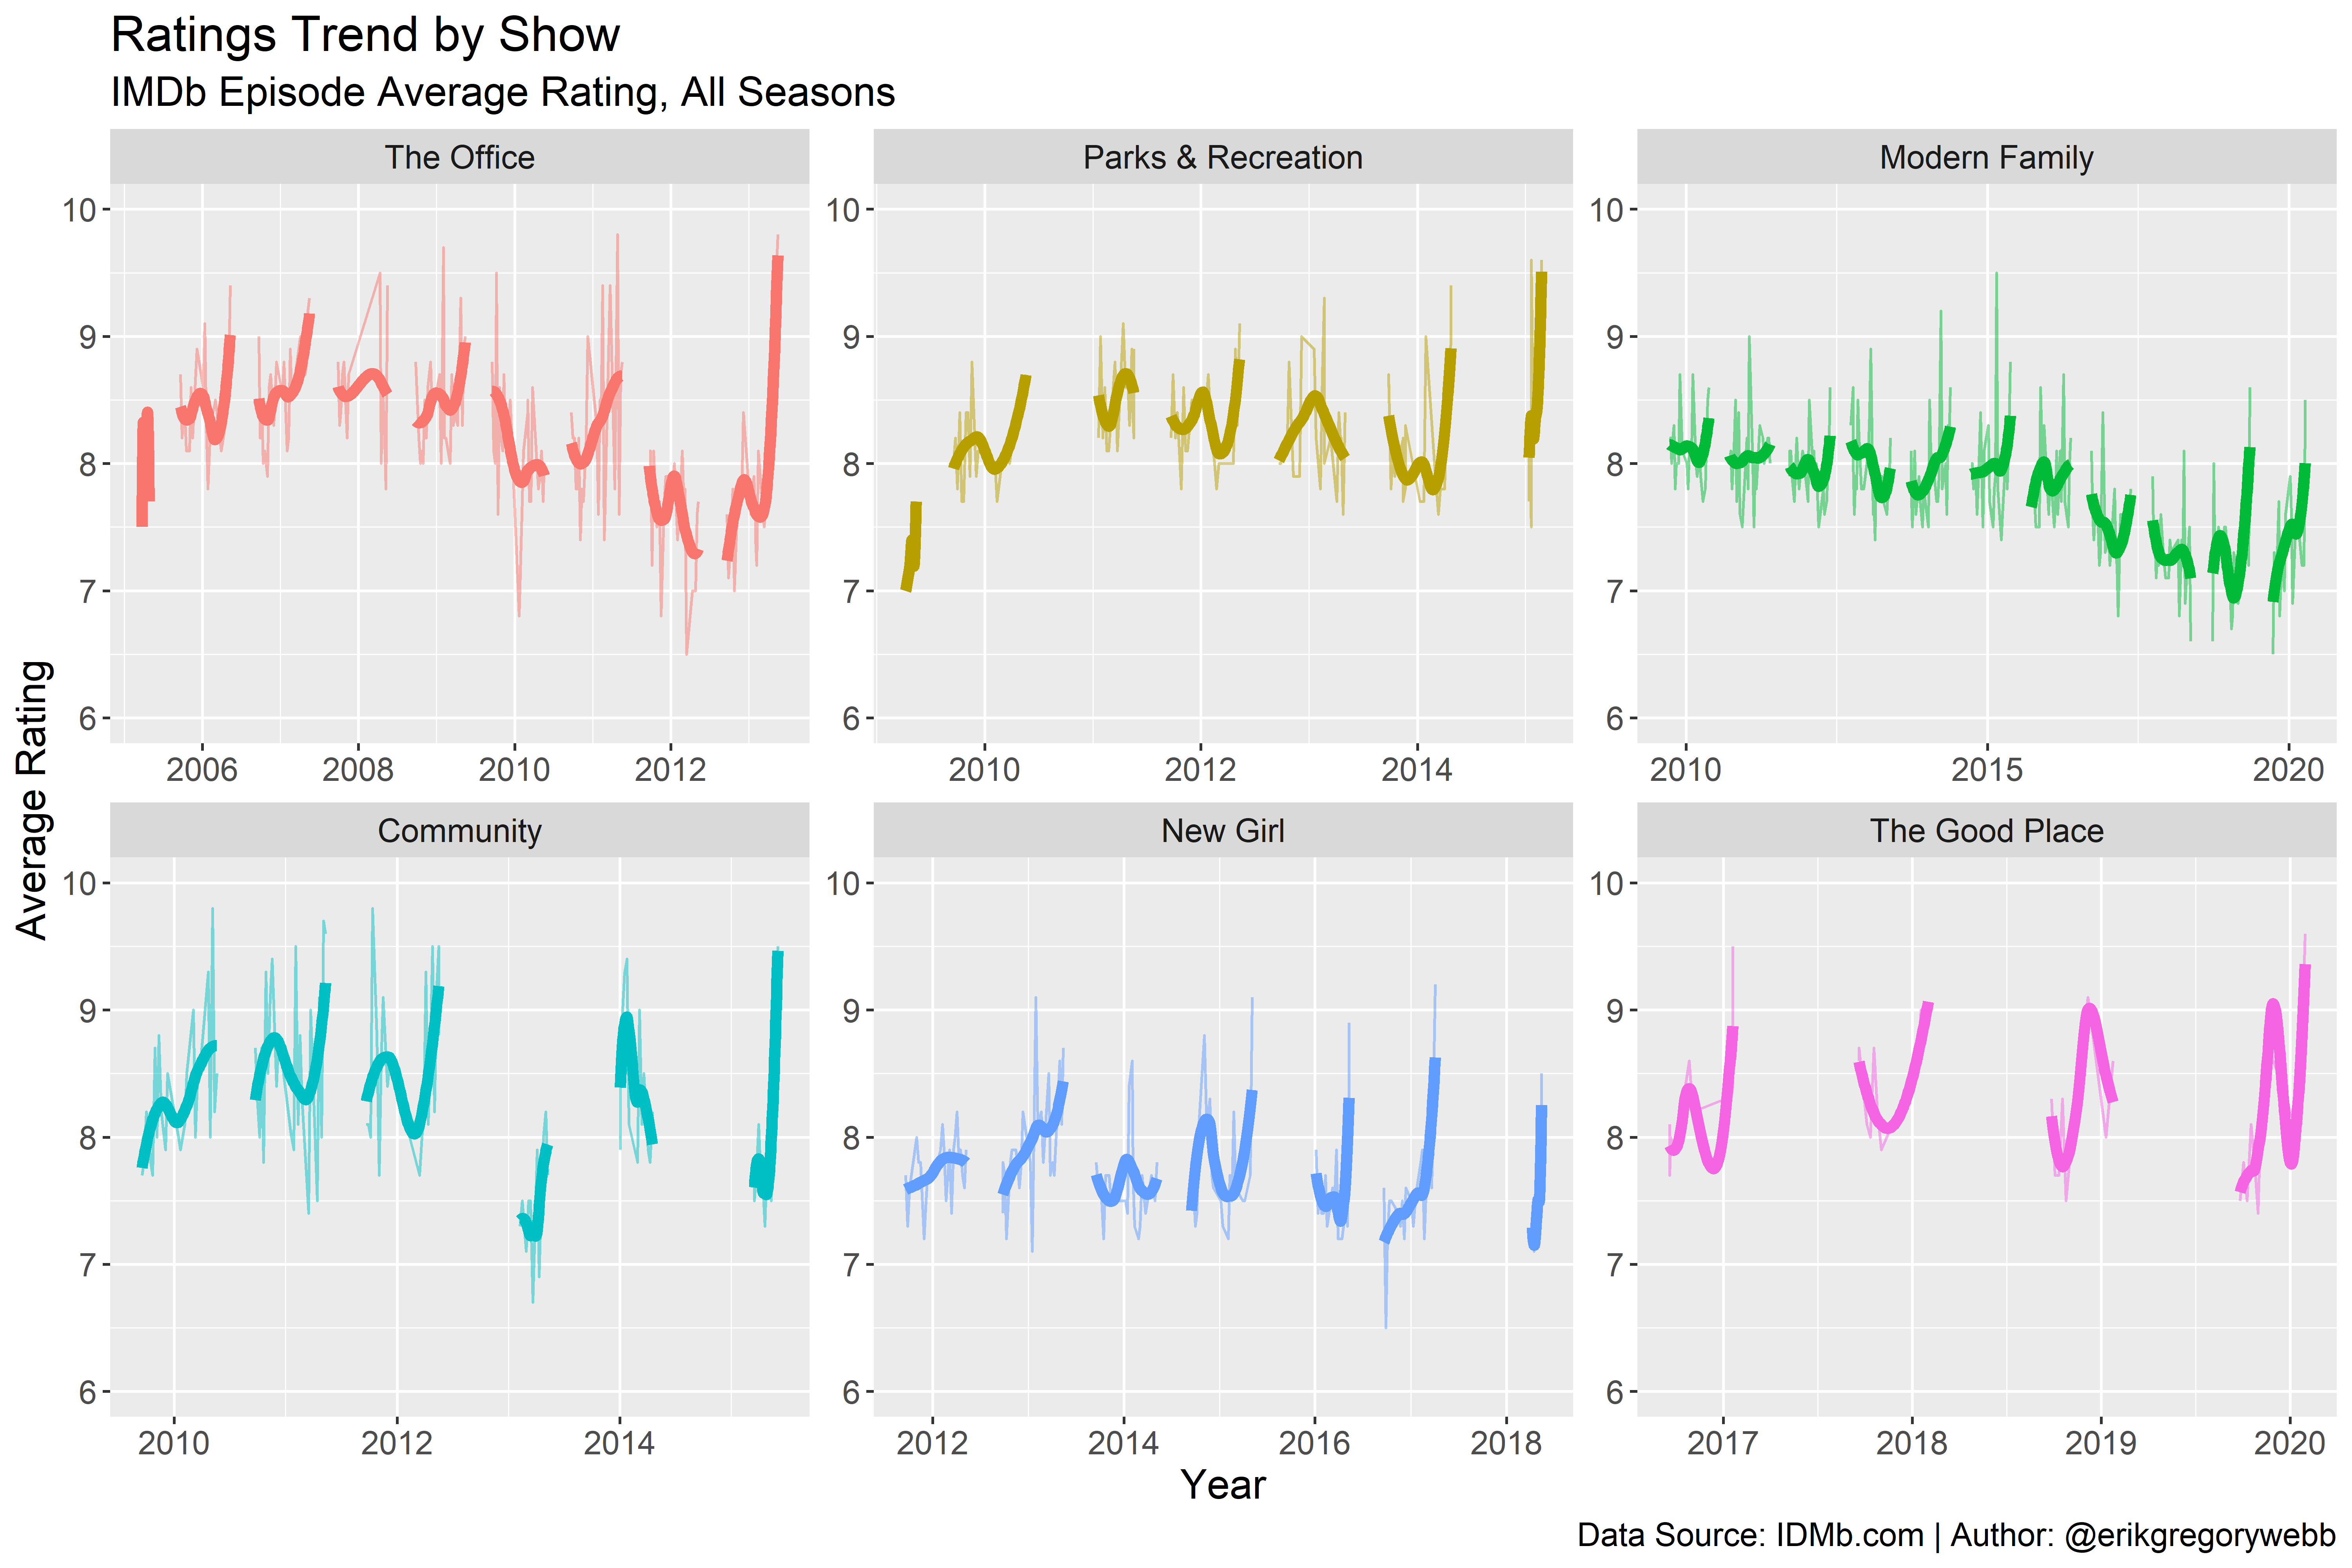
A few show-specific observations:
The Office: It’s pretty easy to spot the impact of Michael’s (Steve Carell) departure from the show at the end of the seventh season. The final season punches below average until the last three episodes, which audiences appeared to adore (9.1, 9.5, and 9.8, respectively).
Community: Something is obviously off in season four. Wikipedia notes: “The [fourth] season marked the departure of show-runner Dan Harmon and overall received mixed reviews from critics. In the fifth season, Harmon returned as show-runner, and the fourth season was referred to retroactively as ‘the gas-leak year’.”
Modern Family: There’s a clear downward trend in average rating, but the show’s longevity definitely speaks to some kind of loyal fan base.
Character Importance
A dynamic and likeable cast of characters is really a key ingredient to any sitcom; personalities like Schmidt from New Girl, Ron Swanson from Parks & Recreation, or Abed from Community keep audiences coming back for more.
As a proxy for character “importance”, I counted the number of times a character’s name appeared in the IMDb descriptions, divided by the total number of episodes.
Here’s the calculation: The Office has 188 episodes. “Michael” appeared in the episode descriptions 128 times, so his “character importance” is ~68%. The actual value doesn’t matter as much as its relative position compared to other characters.
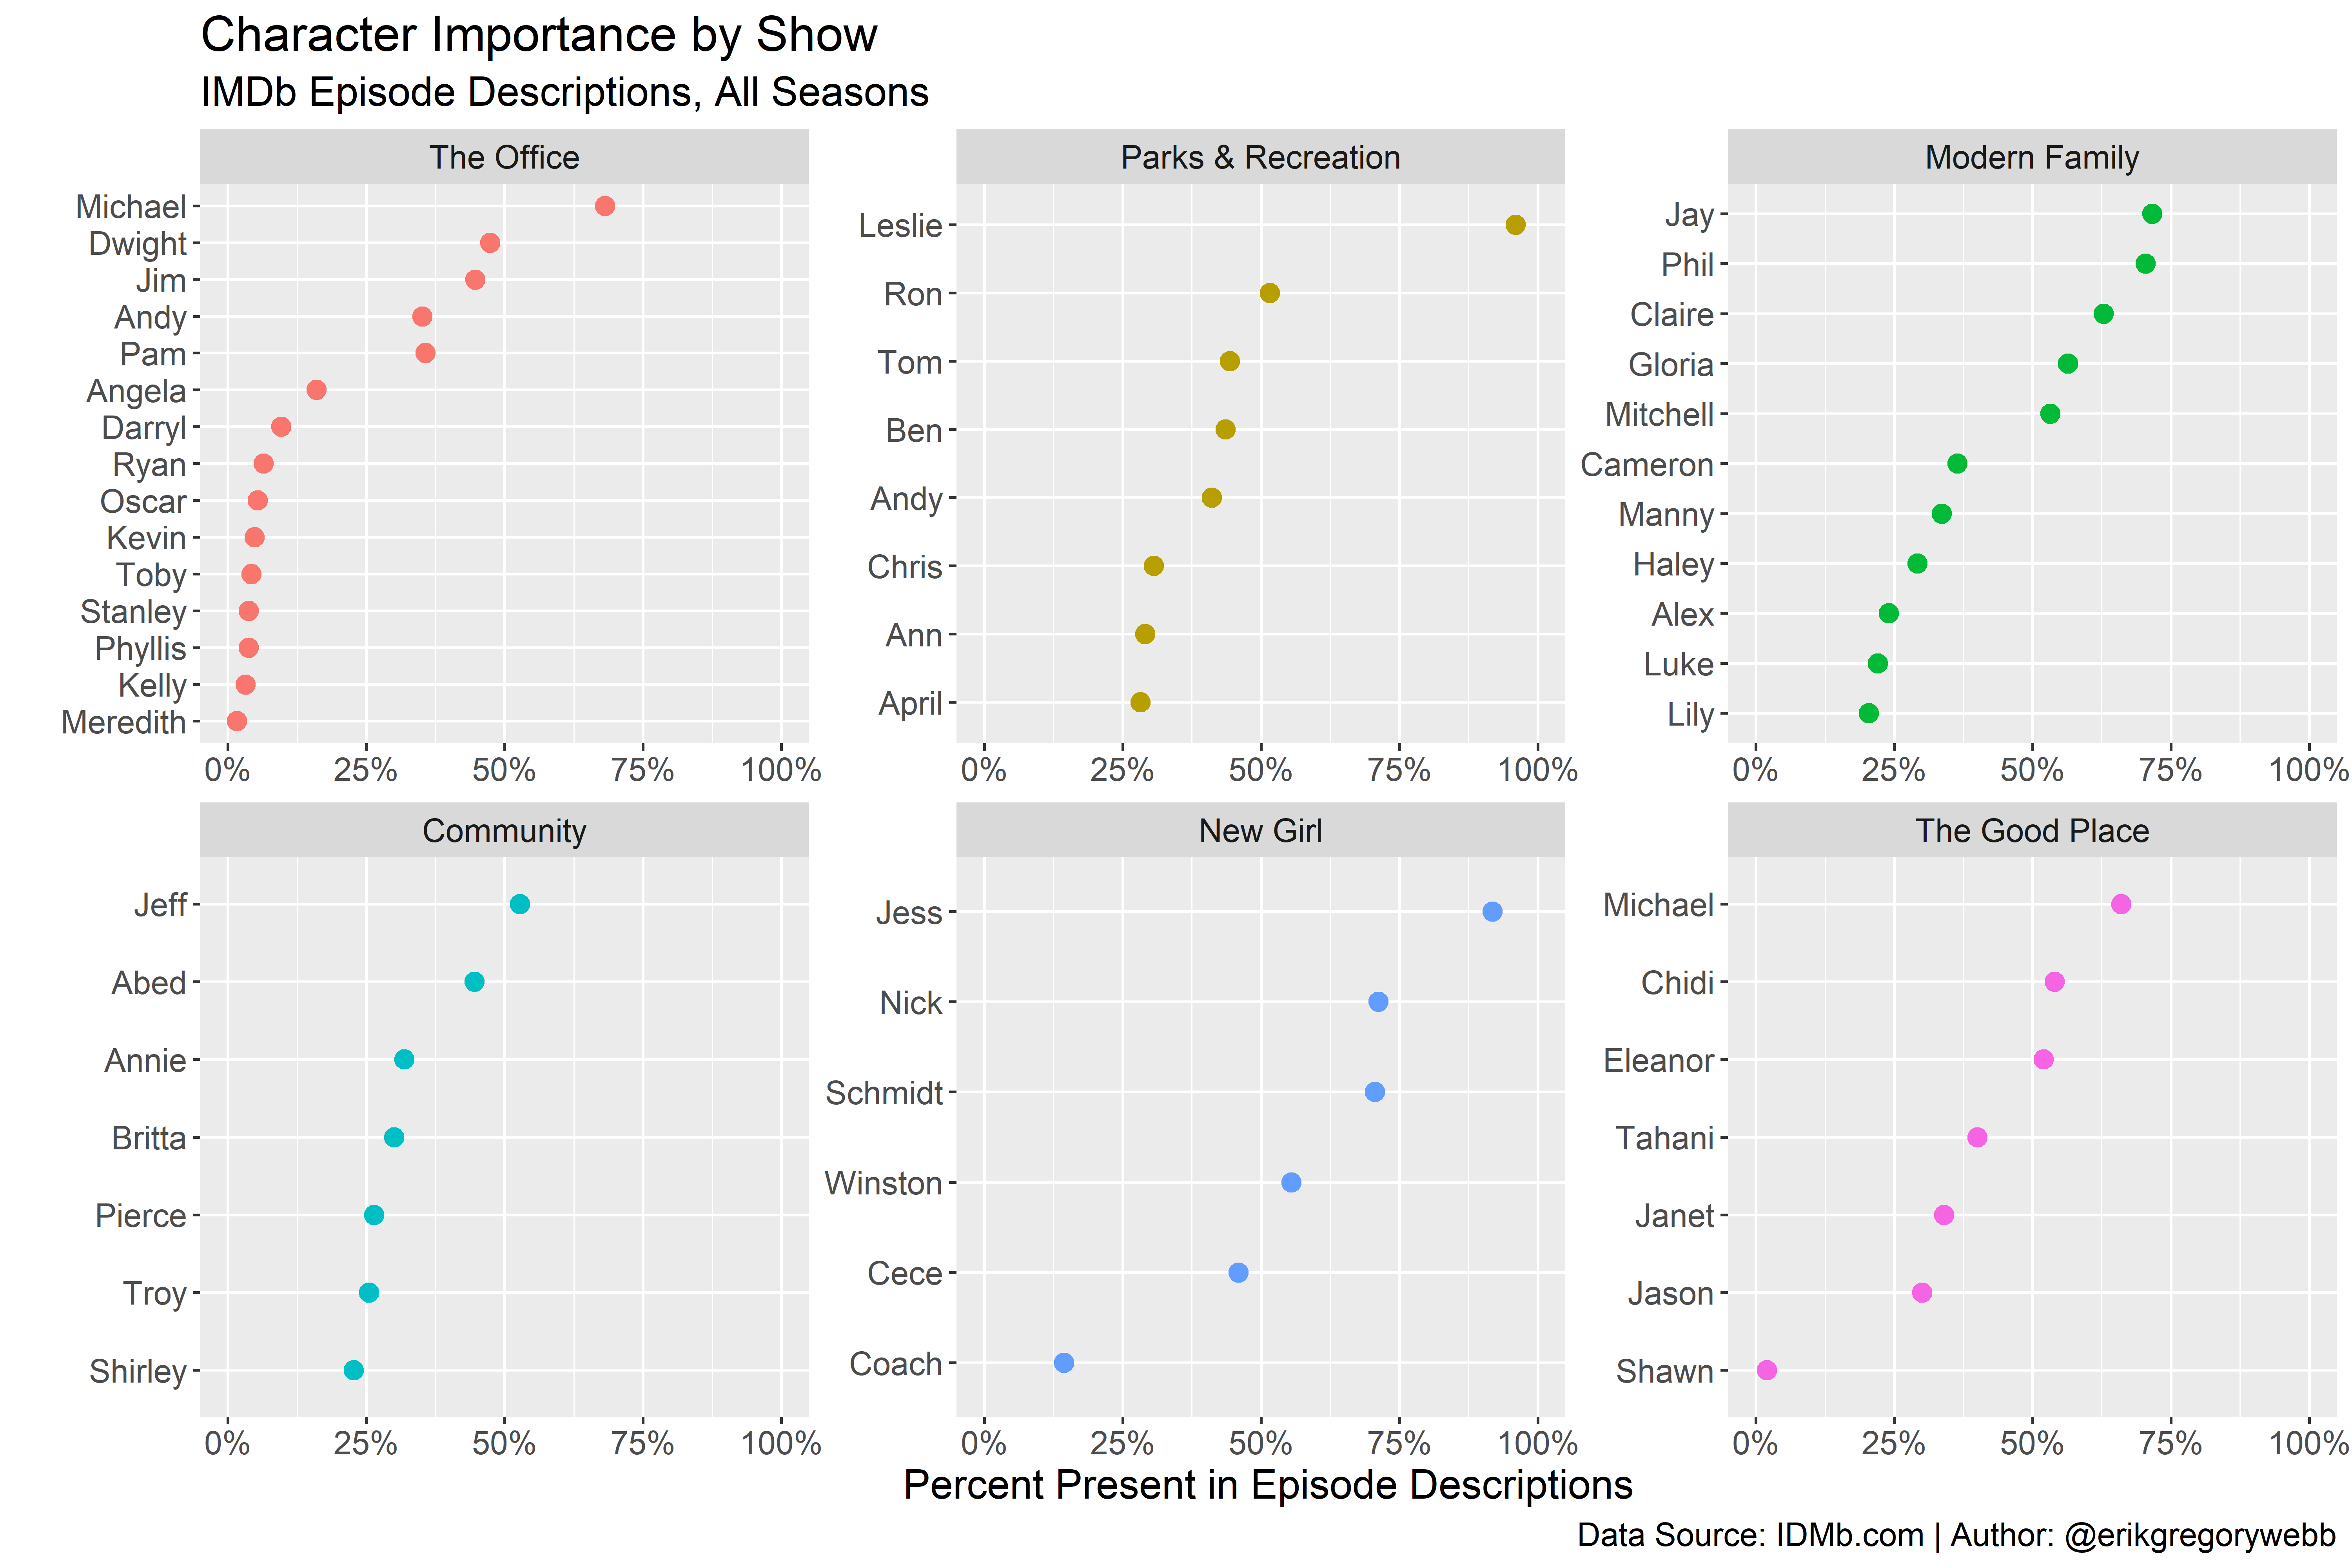
Community and The Good Place seem to have a fairly balanced character line up. In contrast, Parks & Recreation and The Office have an obvious “main” character (Leslie Knope and Michael Scott, respectively), with a solid cast of supporting personalities.
Keep in mind, this metric is a pretty rough proxy for character importance; a much better measure would be something like percentage of screen time or dialogue.
Code Walkthrough
Let’s start by pulling in the necessary packages.
Next, we’ll create a tibble (tidyverse data frame) containing a list of TV shows to scrape from IMDb.
Sourcing the imdb_id is easy, just search for the show you’re interested in and pull the last component of the URL (e.g. imdb.com/title/tt1442437 for Modern Family).
Next, define a scraper function to extract the key data elements (like episode name, average rating, and description). Here we loop over the list of shows and seasons previously defined.
After some cleaning, the data is ready to visualize. The geom_smooth function powers the overlaid bold line to emphasize the overall trend.
The code above is what produces the ratings trend chart:
Next, I used the str_detect() function from the stringr package to count the number of times a character name appeared in the episode descriptions. For example, Michael, Dwight, and Jim would have been counted once in the description below:
Ready to finalize his deal for a new condo, Michael is away with Dwight while Jim rallies the staff together for office games.
“Office Olympics”, The Office Season 2
As described previously, the “character importance” calculation is as simple as dividing the number of times a character’s name appears in the episode descriptions divided by the total number of episodes in the show.
The code above is what produces the character importance chart:
That’s it. Now you can impress (or bore) your friends and family with data-driven TV sitcom trivia, like a a true nerd. You can find the full code here.