Hip Hop’s 2023 Heavyweights

With over 15 million listeners, Spotify’s RapCaviar has been called “the most influential playlist in music.” RapCaviar is curated by Spotify’s editorial team and updated daily to represent the latest and greatest hip-hop and rap tracks.

For the last year, I’ve saved a daily snapshot of the playlist using the Spotify API to empirically determine the biggest rappers in hip hop today. In this post, we’ll use hard data to approximate influence, hustle, and longevity for rap’s biggest names during 2023.

Methodology

To collect the data, I scheduled a Python script to run daily to (1) hit Spotify’s API to collect the RapCaviar track list and (2) save the resulting data frame as a .csv file to an S3 bucket. After pulling down and combining all daily files from S3 using an R script, the tidied dataset contains 11 fields:

Field NameSample Value
Playlist Id37i9dQZF1DX0XUsuxWHRQd
Playlist NameRapCaviar
Track Playlist Position2
Track NameMad Max
Track Id2i2qDe3dnTl6maUE31FO7c
Track Release Date2022-12-16
Track Added At2022-12-30
Artist Track Position1
Artist NameLil Durk
Artist Id3hcs9uc56yIGFCSy9leWe7
Date2023-01-02
The value for “artist track position” helps distinguish owners from features. For example, both Lil Durk and Future participate in the track Mad Max. Since it’s Lil Durk’s song and Future is the feature, a two row exists in the dataset, with values of “artist track position” set to 1 (Lil Durk) and 2 (Future).

After the cleaning and duplication process, the dataset contains 469 total tracks with 271 distinct artists represented across 351 distinct playlist snapshots between January 1 to December 27, 2023.

Metrics

Influence

Let’s start with influence: what percent of available days was a given artist represented on the playlist? For example, if an artist appeared in 50 of the 351 possible daily snapshots, their “influence” score would be 14.2%.

Here are the top ten rappers ranked by this influence metric, for 2023:

NameDays RepresentedPercent of Available
Drake351100%
Future351100%
Gucci Mane351100%
Travis Scott351100%
21 Savage34498%
Kodak Black33094%
Yeat32893%
Latto31189%
Lil Uzi Vert30988%
Quavo30286%

Impressively, four artists yielded sufficient influence to maintain a presence on the playlist every day of the year: Drake, Future, Gucci Mane, and Travis Scott. Here’s a visual representation of their dominant year:
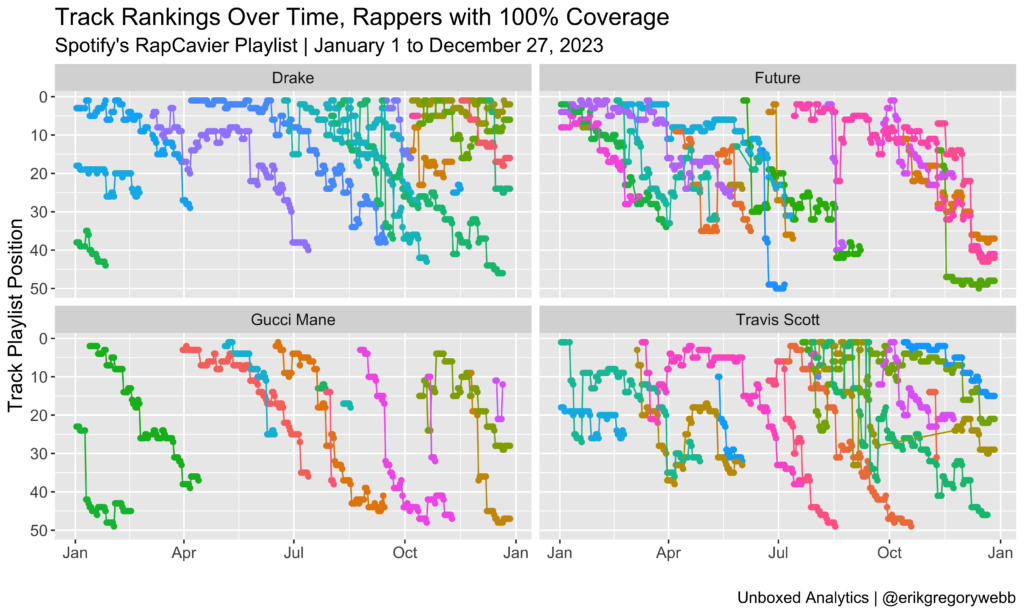
Each colored line represents a unique track. With the y-axis reversed, the chart shows how new tracks enter the playlist positioned near the top and then descend over time. The biggest surprise to me is Gucci Mane, who managed to maintain his presence on the playlist via 14 distinct tracks released throughout the year:
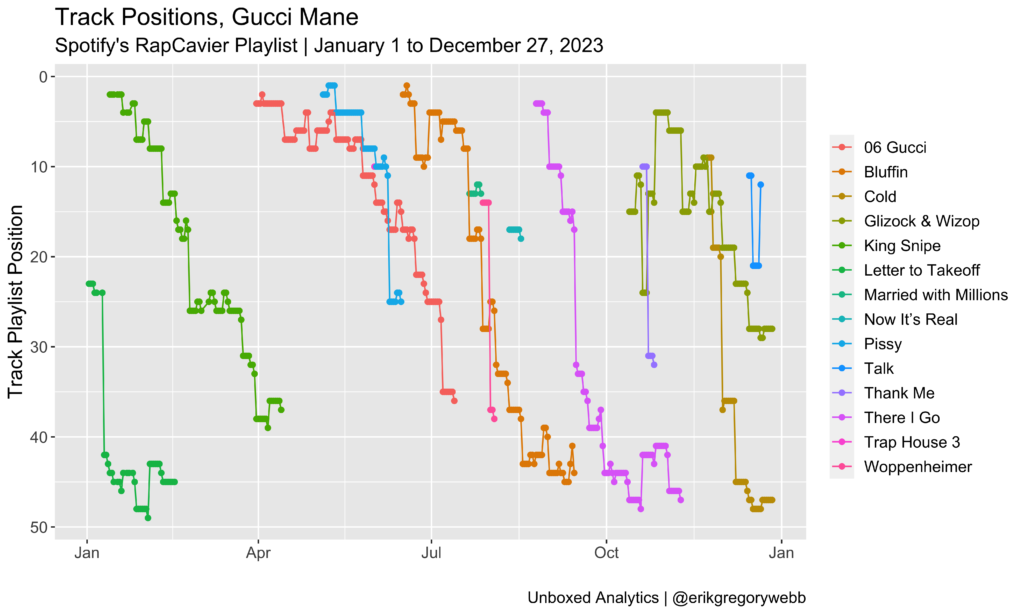
The hustle shown here reminds me of my favorite Lil Wayne clip of all time.

Notably, 21 Savage was only a week short of full coverage, coming in at 98%.

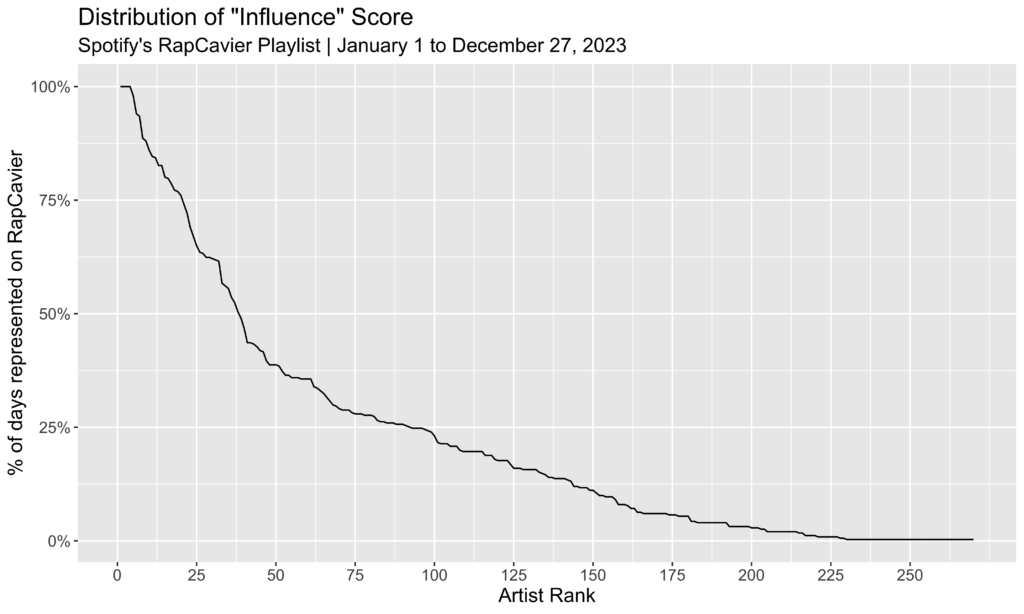
Looking at the distribution of influence scores for all artists appearing at least once during the year, 38 (14%) were present in the RapCaviar playlist more than half of the year:
Density

It’s one thing for an artist to have one of their tracks represented on RapCaviar, but the heavyweights often have several at once. “Density” is calculated as a distinct count of tracks by artist and day.

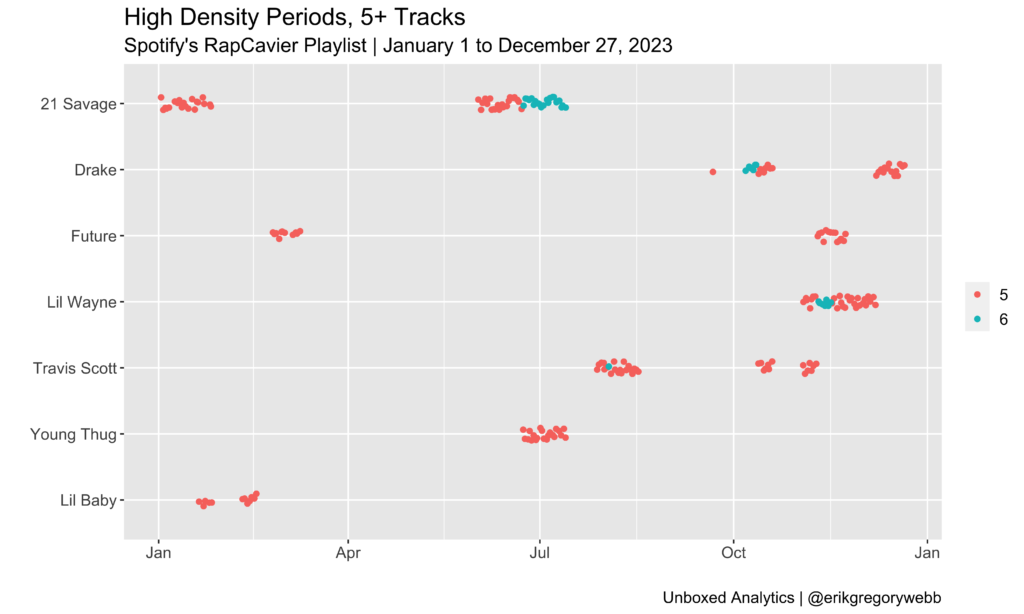
The highest density score for 2023 was 6, a score achieved by just four rappers:

DensityArtist | Dates
6 tracks21 Savage | Jun 23 – Jul 13 (21 days)
6 tracksLil Wayne | Nov 10 – 16 (7 days)
6 tracksDrake | Oct 7 – 12 (6 days)
6 tracksTravis Scott | Aug 3 (1 day)

Most impressive is 21 Savage’s dominant 21-day, 6-track run over the summer, preceded by a 20-day, 5-track run. Notably, during the 6-track spree, all six were features or joint tracks:

  1. Pull Up (feat. 21 Savage)
  2. Wit Da Racks (feat. 21 Savage, Travis Scott & Yak Gotti)
  3. Peaches & Eggplants (feat. 21 Savage)
  4. 06 Gucci (feat. DaBaby & 21 Savage)
  5. War Bout It (feat. 21 Savage)
  6. Spin Bout U (with Drake)

Contributing to more than 10% of the playlist’s track count simultaneously is truly impressive (RapCaviar usually has 50 tracks total); rap’s heavyweights are dense.

Longevity

Finally, let’s consider longevity, meaning how long an artist’s tracks remains on the playlist. Here are the top ten songs by lifespan on the RapCaviar track list during ’23:

TrackArtistDaysFirst DayLast Day
f*kumeanGunna179Jun 19Dec 14
Turn Yo Clic UpQuavo167Jul 14Dec 27
Search & RescueDrake161Apr 7Sep 15
500lbsLil Tecca159Jul 21Dec 27
I KNOW ?Travis Scott153Jul 28Dec 27
Paint The Town RedDoja Cat146Aug 4Dec 27
MELTDOWNTravis Scott143Aug 1Dec 21
Private LandingDon Toliver136Feb 24Jul 13
SuperheroMetro Boomin135Jan 2May 25
All My LifeLil Durk133May 12Sep 21

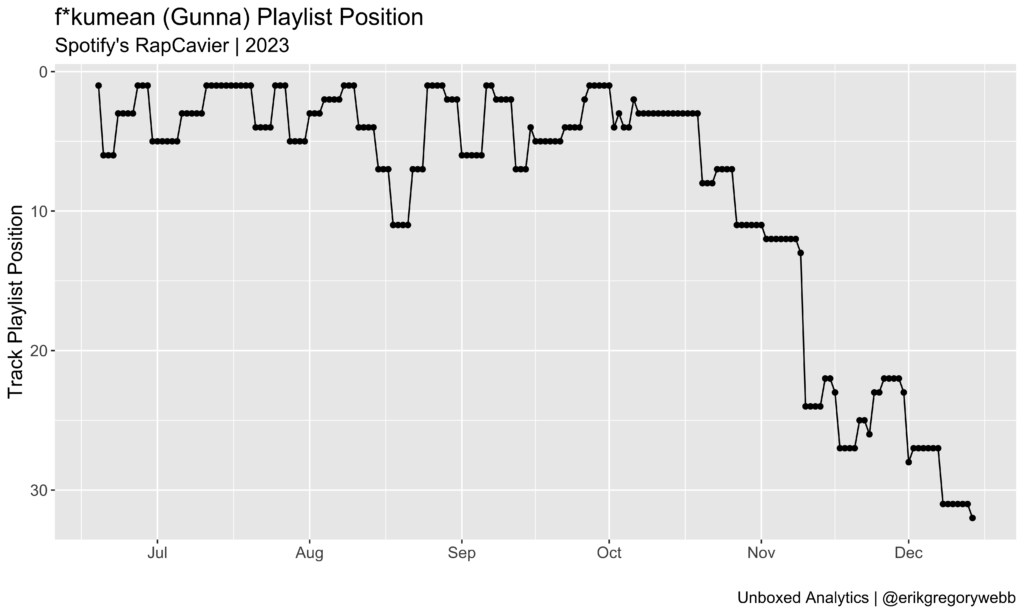
Importantly, four of the tracks in the top ten are still active (italicized above), so there’s a decent chance Turn Yo Clic Up could outlive f*kumean. Speaking of which, Gunna’s first top-ten solo single managed to spend almost six months on RapCaviar, complete with a position surge in mid-August:
Zooming in, here’s the position history for all of those top ten tracks:
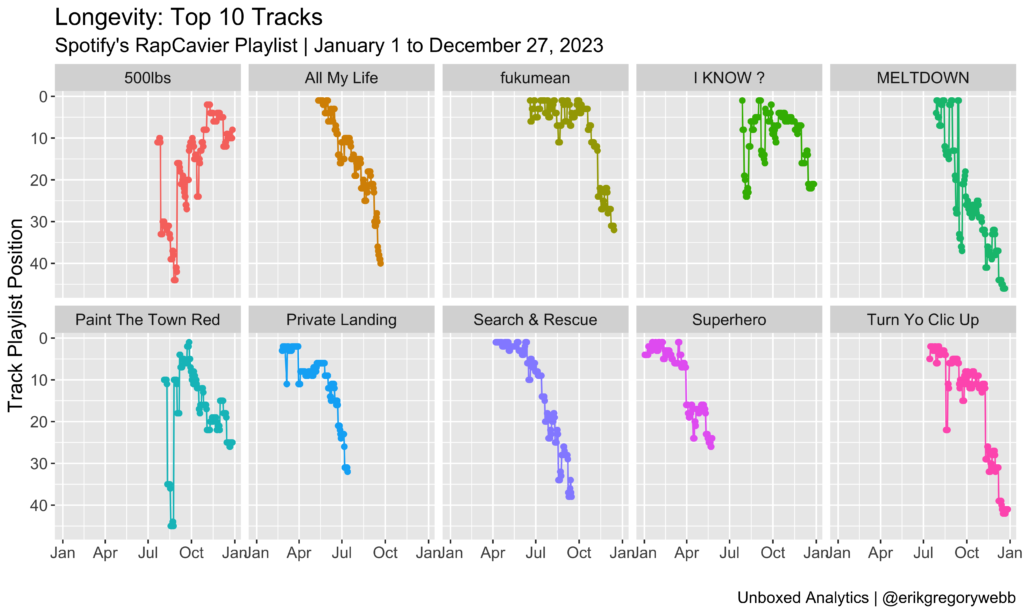
Most of the time, a track will debut on the playlist and then fade out over time, sinking deeper in the set list before falling off. Good examples are All My Life, Private Landing, and Search & Rescue. Hits like 500lbs and Paint The Town Red are more anomalous, with momentum building within the playlist over time.

To close this metric out, let’s look at the top ten rappers with the highest average longevity per track, for those artists with three or more distinct tracks ever appearing on the playlist during the year:

NameMedian LongevityAverage LongevityTrack Count
Gunna1161034
Metro Boomin92966
Ice Spice96724
Latto75744
Moneybagg Yo75696
Lil Uzi Vert68648
Don Toliver41645
Toosii79633
Key Glock61624
Sexyy Red63624
Conclusion

The influence and density metrics point toward the same heavyweights: 21 Savage, Drake, and Travis Scott. This is intuitive since the two metrics are correlated. The longevity metric shines the spotlight on a different subset of rappers, like Gunna, Metro Boomin, and Ice Spice.

Either way, it was a great year for rap. Thanks for reading!

Minivan Wars: Visualizing Prices in the Used Car Market

With the recent birth of our second child, it was time to face a harsh reality: the impending necessity of a minivan. After trying to cope by dreaming up a list of alternative “family” cars, the truth set in: with young kids, features like sliding doors, captain chairs, and amble storage space can’t be beat.

Looking to get acquainted with prices in the used minivan market, I scraped 20 years’ worth of monthly average price data from CarGurus for five minivan models: Kia Sedona, Toyota Sienna, Chrysler Pacifica, Honda Odyssey, and Dodge Grand Caravan. May the best car win!

Source: motortrend.com

As one of the most visited car shopping sites in the United States, CarGurus tracks prices for millions of used car listings every year. With a bit of web scraping (using R), I compiled a dataset to visualize how car prices for used minivans have changed over time.

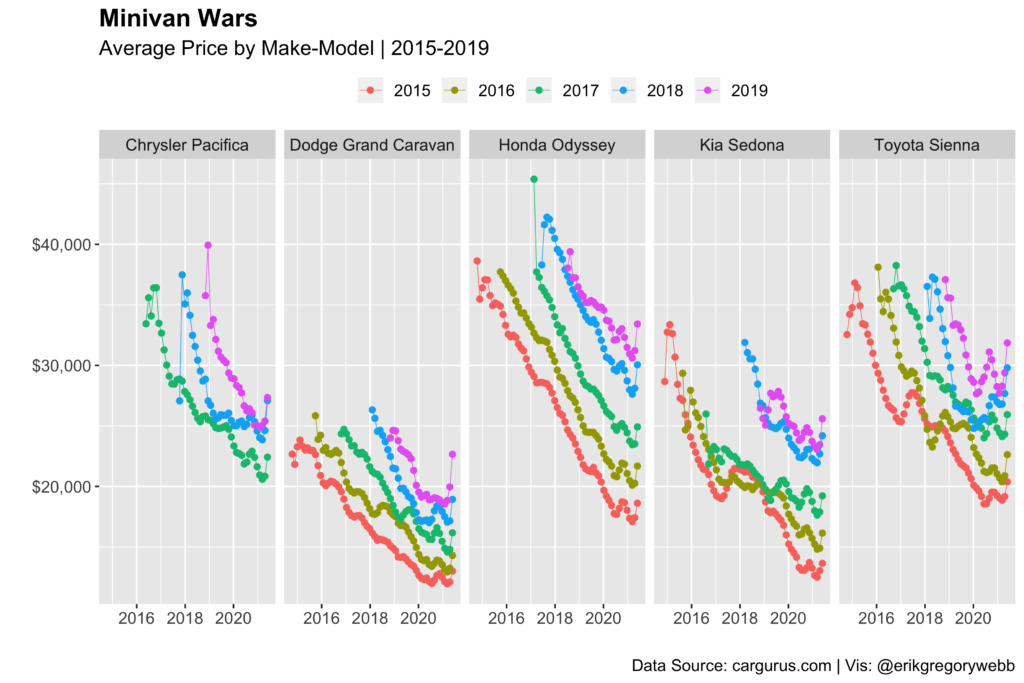
Here’s the result, for minivan models released between 2015 and 2019:

At first glance, my impression is that the Honda Odyssey and Toyota Sienna fall in the “premium” segment of the minivan market (You be the judge: is premium minivan an oxymoron?). On average, prices are higher compared to the Kia Sedona and Dodge Grand Caravan.

Second, I was struck by how steadily deprecation appears to occur for the Honda Odyssey. Roughly speaking, you can expect your Odyssey to depreciate by about $5k a year in the early years of ownership.

Finally, the impact of the COVID-19 pandemic and related semiconductor shortage becomes really clear in this picture. Notice the uptick in average price across the board for almost all make-model and year combinations. Because of the reduced supply of new vehicles (thanks to the semiconductor shortage), would-be buyers of new cars have moved into the used car market, driving up prices.

Bottom line, this visual helped me develop a better feel for the prices we’ll encounter in the used minivan market. You can find the script used to create the dataset here (and below), and the dataset itself here. Thanks for reading!

Which programming language should I learn first?

Aspiring programmers and data scientists often ask, “Which programming language should I learn first?” It’s a valid question, since it can take hundreds of hours of practice to become competent with your first programming language. There are a couple of key factors to take into consideration, like how easy the language is to learn, the job market for the language, and the long term prospects for the language.

In this post, we’ll take a data-driven approach to determining which programming languages are the most popular and growing the fastest in order to make an informed recommendation to new entrants to the developer community.

Common Programming Languages (Source)

Quantifying Popularity

There are several ways you could measure the popularity or growth of programming languages over time. The PYPL (PopularitY of Programming Language Index) is created by analyzing how often language tutorials are searched on Google; the more a language tutorial is searched, the more popular the language is assumed to be.

Another avenue could be analyzing GitHub metadata. GitHub is the largest code host in the world, with 40 million users and more than 100 million repositories (source). We could quantify the popularity of a programming language by measuring the number of pull requests / push requests / stars / issues over time (example, example).

Finally, the popularity proxy I’ll use is the number of questions posted by programming language on Stack Overflow. Stack Overflow is a question and answer site for programmers. Questions have tags like java and python which makes it easier for people to find and answer questions.

We’ll visualize how programming languages have trended over the last 10 years based on use of their tags on Stack Overflow.

Data Explorer

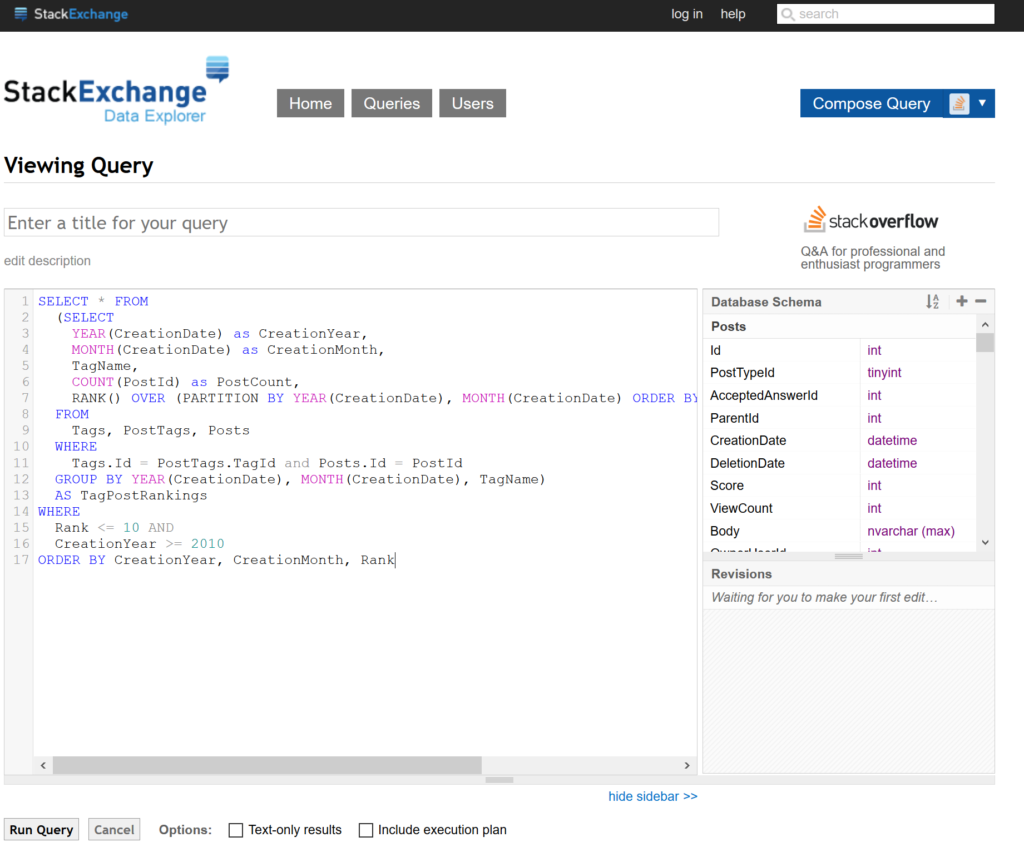
So, how are we going to source this data? Should we scrape all 18 million questions or start hitting the Stack Exchange API? No! There’s an easier way: Stack Exchange (Stack Overflow’s “parent”) exposes a data explorer to run queries against historical data.

Screenshot of the Stack Exchange Data Explorer

In other words, we can review the Stack Overflow database schema and write a SQL query to extract the data we need. Before writing any SQL, let’s think about how we’d like the query output to be structured. Each row should contain a tag (e.g. java, python), a date (year / month), and count of the number of times a question was posted using that tag:

Year | Month | Tag | Question Count

The SQL query below joins the Posts, Tags, and PostTags tables, counts the number of questions by tag each month, and returns the top 100 tags each month:

Below are the first ten rows returned by the query:

YearMonthTagCountRank
20101c#51161
20101java37282
20101php34423
20101javascript26204
20101.net23405
20101jquery23386
20101iphone22467
20101asp.net22138
20101c++20029
20101python194910

Great, now we have the data we need. Next, how should we visualize it to measure programming language popularity over time? Let’s try an animated bar race chart using Flourish. Flourish is an online data studio that helps you visualize and tell stories with data.

In order to get the data into the right format for Flourish visualization, we’ll use R to filter and reshape the data. To smooth the trend, we’ll also calculate a moving average of tag question count.

After uploading the reshaped data to Flourish and formatting the animated bar race chart, we can sit back and watch the programming languages fight it out for the top spot over the last decade:

It’s hard to miss the steady rise of Python, hovering in fourth and five place from 2010 to 2017 before accelerating into first place by late 2018.

Why has Python become so popular? First, it’s more concise and requires less time, effort, and lines of code to perform the same operations as languages like C++ and Java. Python is well-known for its simple programming syntax, code readability and English-like commands. For those reason, not to mention its rich set of libraries and large community, Python is a great place to start for new programmers and data scientists.

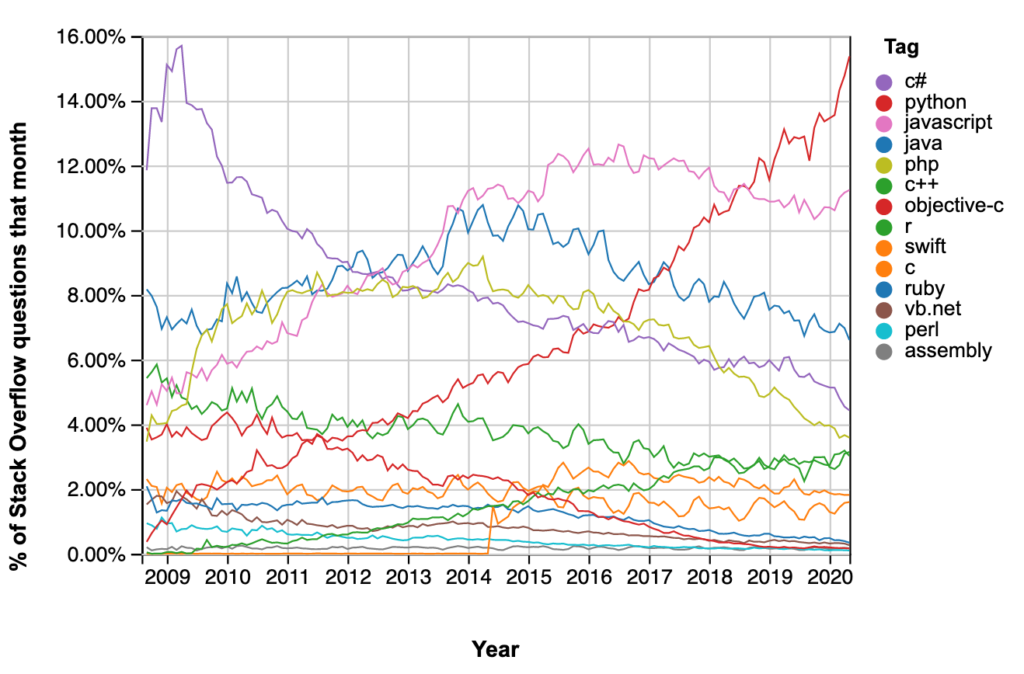
The story our animated bar chart tells is validated by the reporting published by Stack Overflow Insights, where we see Python growing steadily over time, measured as a percentage of questions asked on Stack Overflow in a month:

Conclusion

Using question tag data from Stack Overflow, we’ve determined that Python is probably the best programming languages to learn first. We could have saved ourselves some time and done a simple Google search or consulted Reddit to come to the same conclusion, but there’s something satisfying about validating the hype with real data.

Trends in Vault Banking Rankings

As a society, we love to rank things. We rank colleges (US News & World Report), companies (Fortune 500), sports teams (AP Top 25 Poll), and even people (IMBd STARmeter).

Sometimes rankings are useful, since they collapse many data points into a single metric, allowing for easy comparison. The problem is when rankings build on subjective methodologies or abstract criteria are taken as absolute truth, rather than a directional guide.

With that disclaimer as backdrop, it’s no surprise that Vault.com surveys professionals to rank the top employers in industries like law, consulting, and banking. The rankings they produce are based on surveys that try to measure things like prestige, culture, satisfaction, work/life balance, training, and compensation.

Vault rankings are created using “a weighted formula that reflects the issues professionals care most about”, such as prestige, culture, and satisfaction (source)

Obviously, the inputs (“prestige” and “culture”) are inherently abstract and highly subjective, so the output (rankings) is likely to be noisy and subjective as well. That said, I was interested to see how rankings, specifically in banking, had changed over time, so I compiled the Top 50 lists from 2011 to 2020.

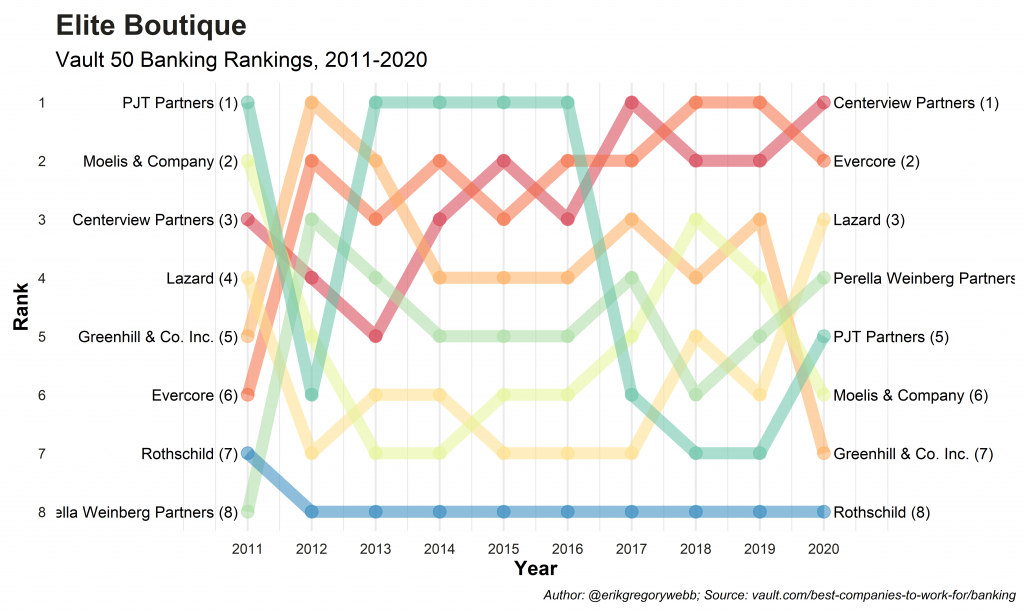
The lists are composed of companies across the banking spectrum, from bulge bracket firms like Goldman Sachs and Morgan Stanley to elite boutiques like Centerview and Evercore to middle market banks like Piper Sandler and Raymond James.

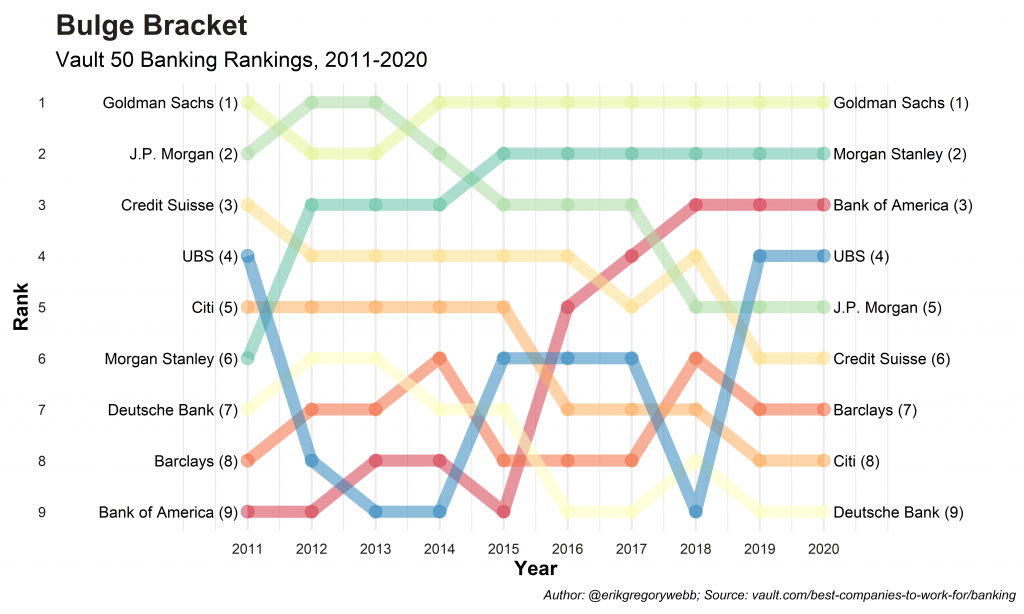
Below are the results for the bulge bracket and elite boutique segments, along with a few observations, based on loose categories suggested by mergersandinquisitions.com.

  • Dominance of GS: Over the ten year period, Goldman only dipped below #1 briefly, in 2012-13.
  • Decline of JPM: Despite clenching the #1 spot in 2012-13, JPM declined in the following years, landing at #5 in 2020.
  • Growth of BAML: Starting in #9 in 2011, BAML’s rank steadily improved over time, hovering at #3 in 2020.

I compiled this data manually, but used r and ggplot to clean and filter the data and create the charts. You can find the full repo on Github here.

Import, Define ggplot Theme

Plot

Export

Thanks for reading! Feel free to check out my other blog posts or click a tag below to see related blog posts.

Studying Trends in World Religion using R

Using a data set from the Pew Research Center, this post is about unpacking trends in world religion. The data set contains estimated religious compositions by country from 2010 to 2050.

Sourcing the Data

Made readily available via Github, the file was easy to import into the R environment. Reshaping the data (wide to long format) using the tidyverse “gather” function simplifies plotting down the road.

After reshaping, the data resembles the table below:

Visualizations

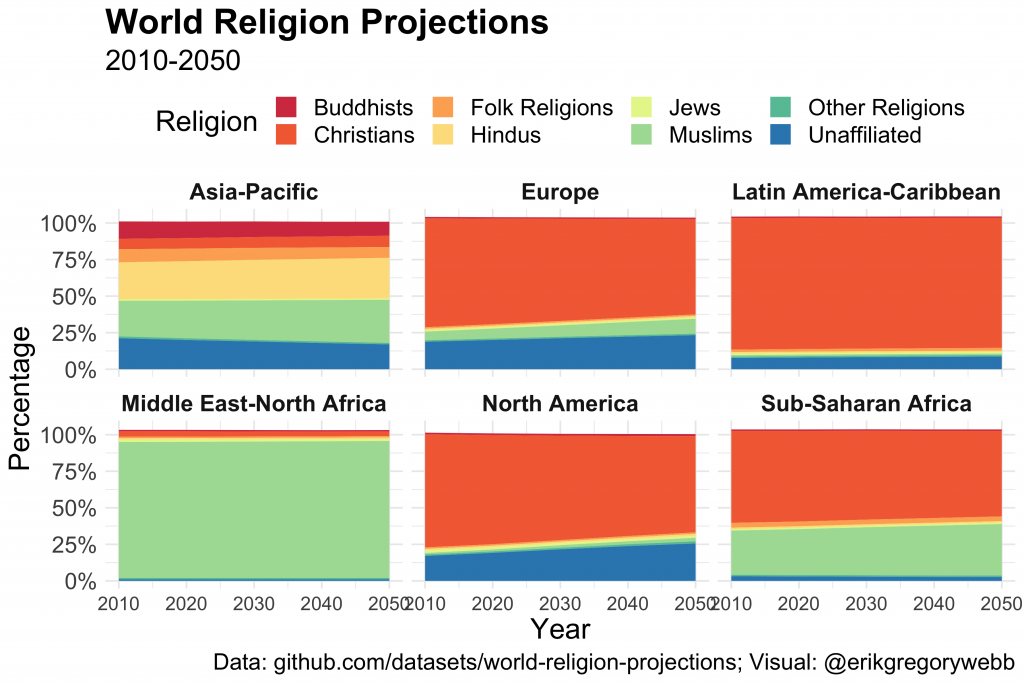
Let’s start by visualizing religious composition by region over time.

A few observations:

  • Asia-Pacific has the least concentrated religious mix, with a “rainbow” assortment of Hindus, Muslims, and Buddhists.
  • Christianity is on the decline in North American and Europe.
  • Simultaneously, the percentage of people reporting to be “unaffiliated” with any religion is growing in North America and Europe.

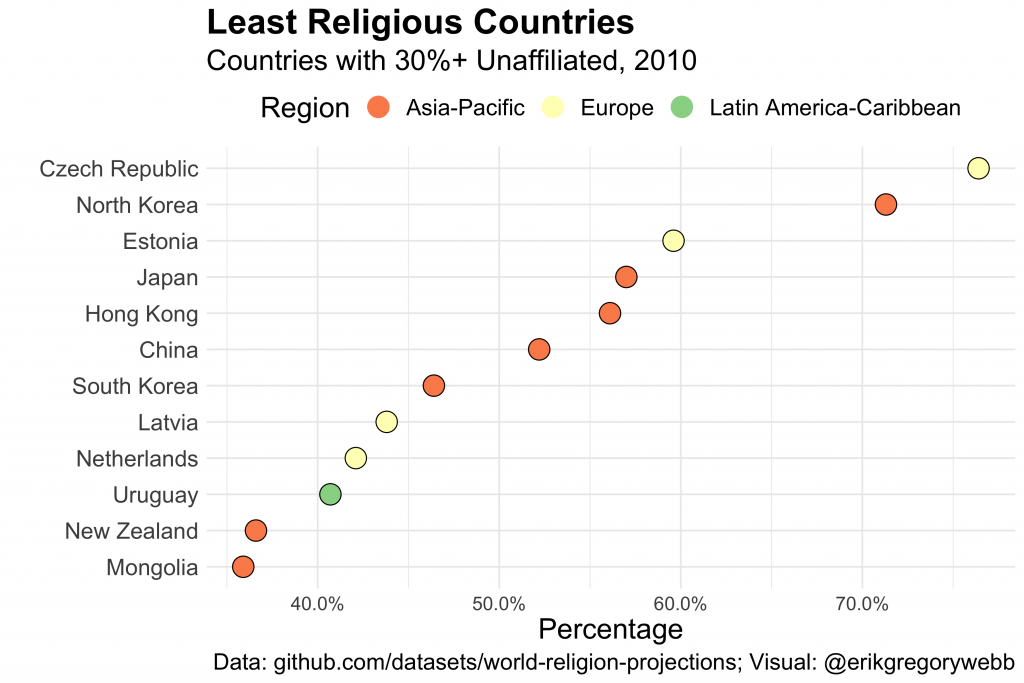
Next, let’s take a look at the least religious countries.

Any patterns of interest?

  • Most of the least religious countries are in Europe and Asian.
  • The Czech Republic tops the list with 76% unaffiliated, beating communist North Korea by a full five percentage points.
  • 50%+ of the China, Hong Kong, and Japan population is non-religious.

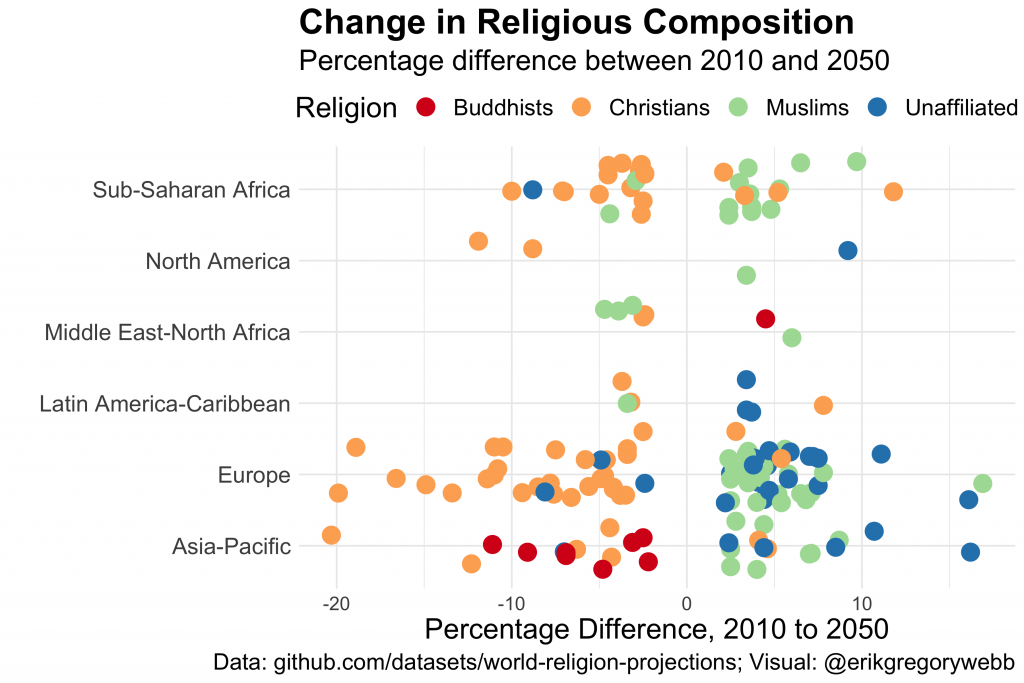
Lastly, what will change between 2010 and 2050?

For simplicity, I’ve only included differences greater or less than 2%.

  • Again, we see evidence of a decline in the percentage of Christians globally, although it appears to be most concentrated in Europe and Sub-Saharan Africa.
  • Meanwhile, a larger portion of the population in places like Europe and Asia-Pacific is expected to be Muslim or non-religious.

Conclusion

This was a good exercise in brainstorming ways to slice a seemingly simple data set in pursuit of insights. You can find the data set for your own analysis here, or find the code that produced the visuals here.

Featured photo by Janilson Alves Furtado from Burst.

Analyzing iPhone Usage Data in R

I’m constantly thinking about how to capture and analyze data from day-to-day life. One data source I’ve written about previously is Moment, an iPhone app that tracks screen time and phone pickups. Under the advanced settings, the app offers data export (via JSON file) for nerds like me.

Here we’ll step through a basic analysis of my usage data using R. To replicate this analysis with your own data, fork this code and point the directory to your ‘moment.json’ file.

Cleaning + Feature Engineering

We’ll start by calling the “rjson” library and bringing in the JSON file.

library("rjson")
json_file = "/Users/erikgregorywebb/Downloads/moment.json"
json_data <- fromJSON(file=json_file)

Because of the structure of the file, we need to “unlist” each day and then combine them into a single data frame. We’ll then add column names and ensure the variables are of the correct data type and format.

df <- lapply(json_data, function(days) # Loop through each "day"
{data.frame(matrix(unlist(days), ncol=3, byrow=T))})

# Connect the list of dataframes together in one single dataframe
moment <- do.call(rbind, df)

# Add column names, remove row names
colnames(moment) <- c("minuteCount", "pickupCount", "Date")
rownames(moment) <- NULL

# Correctly format variables
moment$minuteCount <- as.numeric(as.character(moment$minuteCount))
moment$pickupCount <- as.numeric(as.character(moment$pickupCount))
moment$Date <- substr(moment$Date, 0, 10)
moment$Date <- as.Date(moment$Date, "%Y-%m-%d")

Let’s create a feature to enrich our analysis later on. A base function in R called “weekdays” quickly extracts the weekday, month or quarter of a date object.

moment$DOW <- weekdays(moment$Date)
moment$DOW <- as.factor(moment$DOW)

With the data cleaning and feature engineering complete, the data frame looks like this:

Minute CountPickup CountDateDOW
131542018-06-16Saturday
53462018-06-15Friday
195642018-06-14Thursday
91522018-06-13Wednesday

For clarity, the minute count refers to the number of minutes of “screen time.” If the screen is off, Moment doesn’t count listening to music or talking on the phone. What about a pickup? Moment’s FAQs define a pickup as each separate time you turn on your phone screen. For example, if you pull your phone out of your pocket, respond to a text, then put it back, that counts as one pickup.

With those feature definitions clarified, let’s move to the fun part: visualization and modeling!

Visualization

I think good questions bring out the best visualizations so let’s start by thinking of some questions we can answer about my iPhone usage:

  1. What do the distributions of minutes and pickups look like?
  2. How does the number of minutes and pickups trend over time?
  3. What’s the relationship between minutes and pickups?
  4. Does the average number of minutes and pickups vary by weekday?

Let’s start with the first question, arranging the two distributions side by side.

g1 <- ggplot(moment, aes(x = minuteCount)) +
  geom_density(alpha=.2, fill="blue") +
  labs(title = "Screen Time Minutes",
       x = "Minutes",
       y = "Density") +
  theme_minimal() + 
  theme(plot.title = element_text(hjust = 0.5))

g2 <- ggplot(moment, aes(x = pickupCount)) +
  geom_density(alpha=.2, fill="red") +
  labs(title = "Phone Pickups",
       x = "Pickups",
       y = "Density") +
  theme_minimal() + 
  theme(plot.title = element_text(hjust = 0.5))

grid.arrange(g1, g2, ncol=2)

On average, it looks like I spend about 120 minutes (2 hours) on my phone with about 50 pickups. Check out that screen time minutes outlier; I can’t remember spending 500+ minutes (8 hours) on my phone!

Next, how does my usage trend over time?

g4 <- ggplot(moment, aes(x = Date, y = minuteCount)) +
  geom_line() +
  geom_smooth(se = FALSE) +
  labs(title = "Screen Minutes Over Time ",
       x = "Date",
       y = "Minutes") +
  theme_minimal() +
  theme(plot.title = element_text(hjust = 0.5))

g5 <- ggplot(moment, aes(x = Date, y = pickupCount)) +
  geom_line() +
  geom_smooth(se = FALSE) +
  labs(title = "Phone Pickups Over Time ",
       x = "Date",
       y = "Pickups") +
  theme_minimal() +
  theme(plot.title = element_text(hjust = 0.5))

grid.arrange(g4, g5, nrow=2)

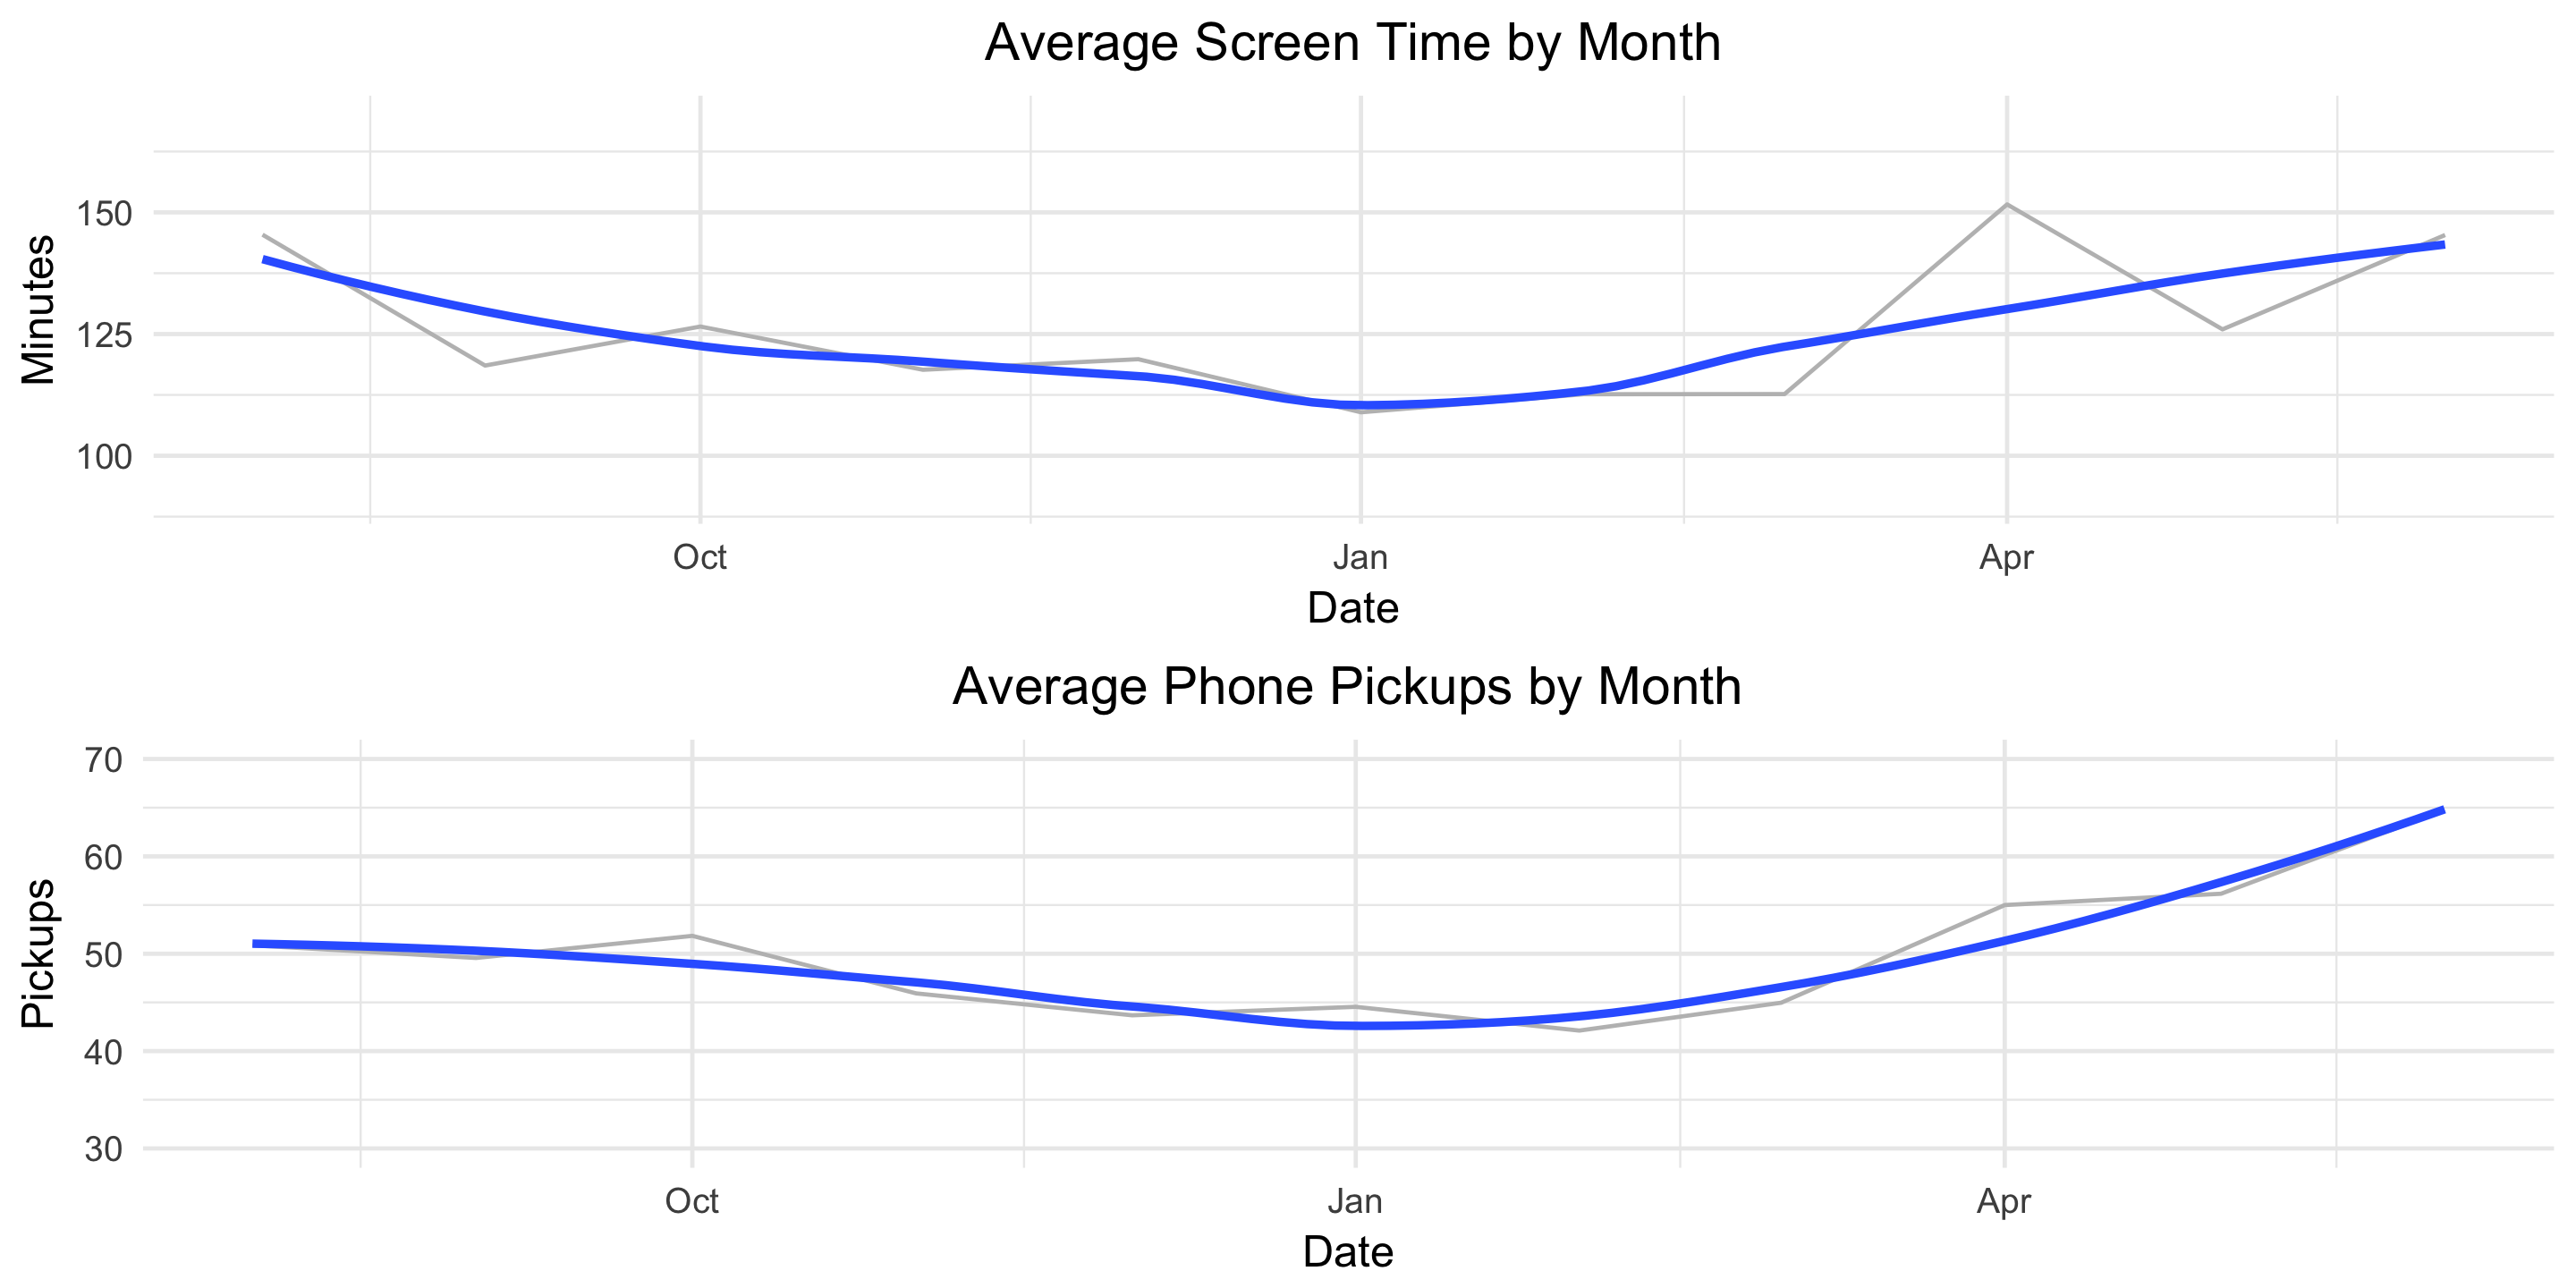
Screen time appears fairly constant over time but there’s an upward trend in the number of pickups starting in late March. Let’s remove some of the noise and plot these two metrics by month.

moment$monyr <- as.factor(paste(format(moment$Date, "%Y"), format(moment$Date, "%m"), "01", sep = "-"))

bymonth <- moment %>%
  group_by(monyr) %>%
  summarise(avg_minute = mean(minuteCount),
            avg_pickup = mean(pickupCount)) %>%
  filter(avg_minute > 50) %>% # used to remove the outlier for July 2017
  arrange(monyr)

bymonth$monyr <- as.Date(as.character(bymonth$monyr), "%Y-%m-%d")
g7 <- ggplot(bymonth, aes(x = monyr, y = avg_minute)) + 
  geom_line(col = "grey") + 
  geom_smooth(se = FALSE) + 
  ylim(90, 170) + 
  labs(title = "Average Screen Time by Month",
       x = "Date",
       y = "Minutes") +
  theme_minimal() +
  theme(plot.title = element_text(hjust = 0.5))

g8 <- ggplot(bymonth, aes(x = monyr, y = avg_pickup)) + 
  geom_line(col = "grey") + 
  geom_smooth(se = FALSE) + 
  ylim(30, 70) + 
  labs(title = "Average Phone Pickups by Month",
       x = "Date",
       y = "Pickups") +
  theme_minimal() +
  theme(plot.title = element_text(hjust = 0.5))

grid.arrange(g7, g8, nrow=2)

This helps the true pattern emerge. The average values are plotted in light grey and overlayed with a blue, smoothed line. Here we see a clear decline in both screen-time minutes and pickups from August until January and then a clear increase from January until June.

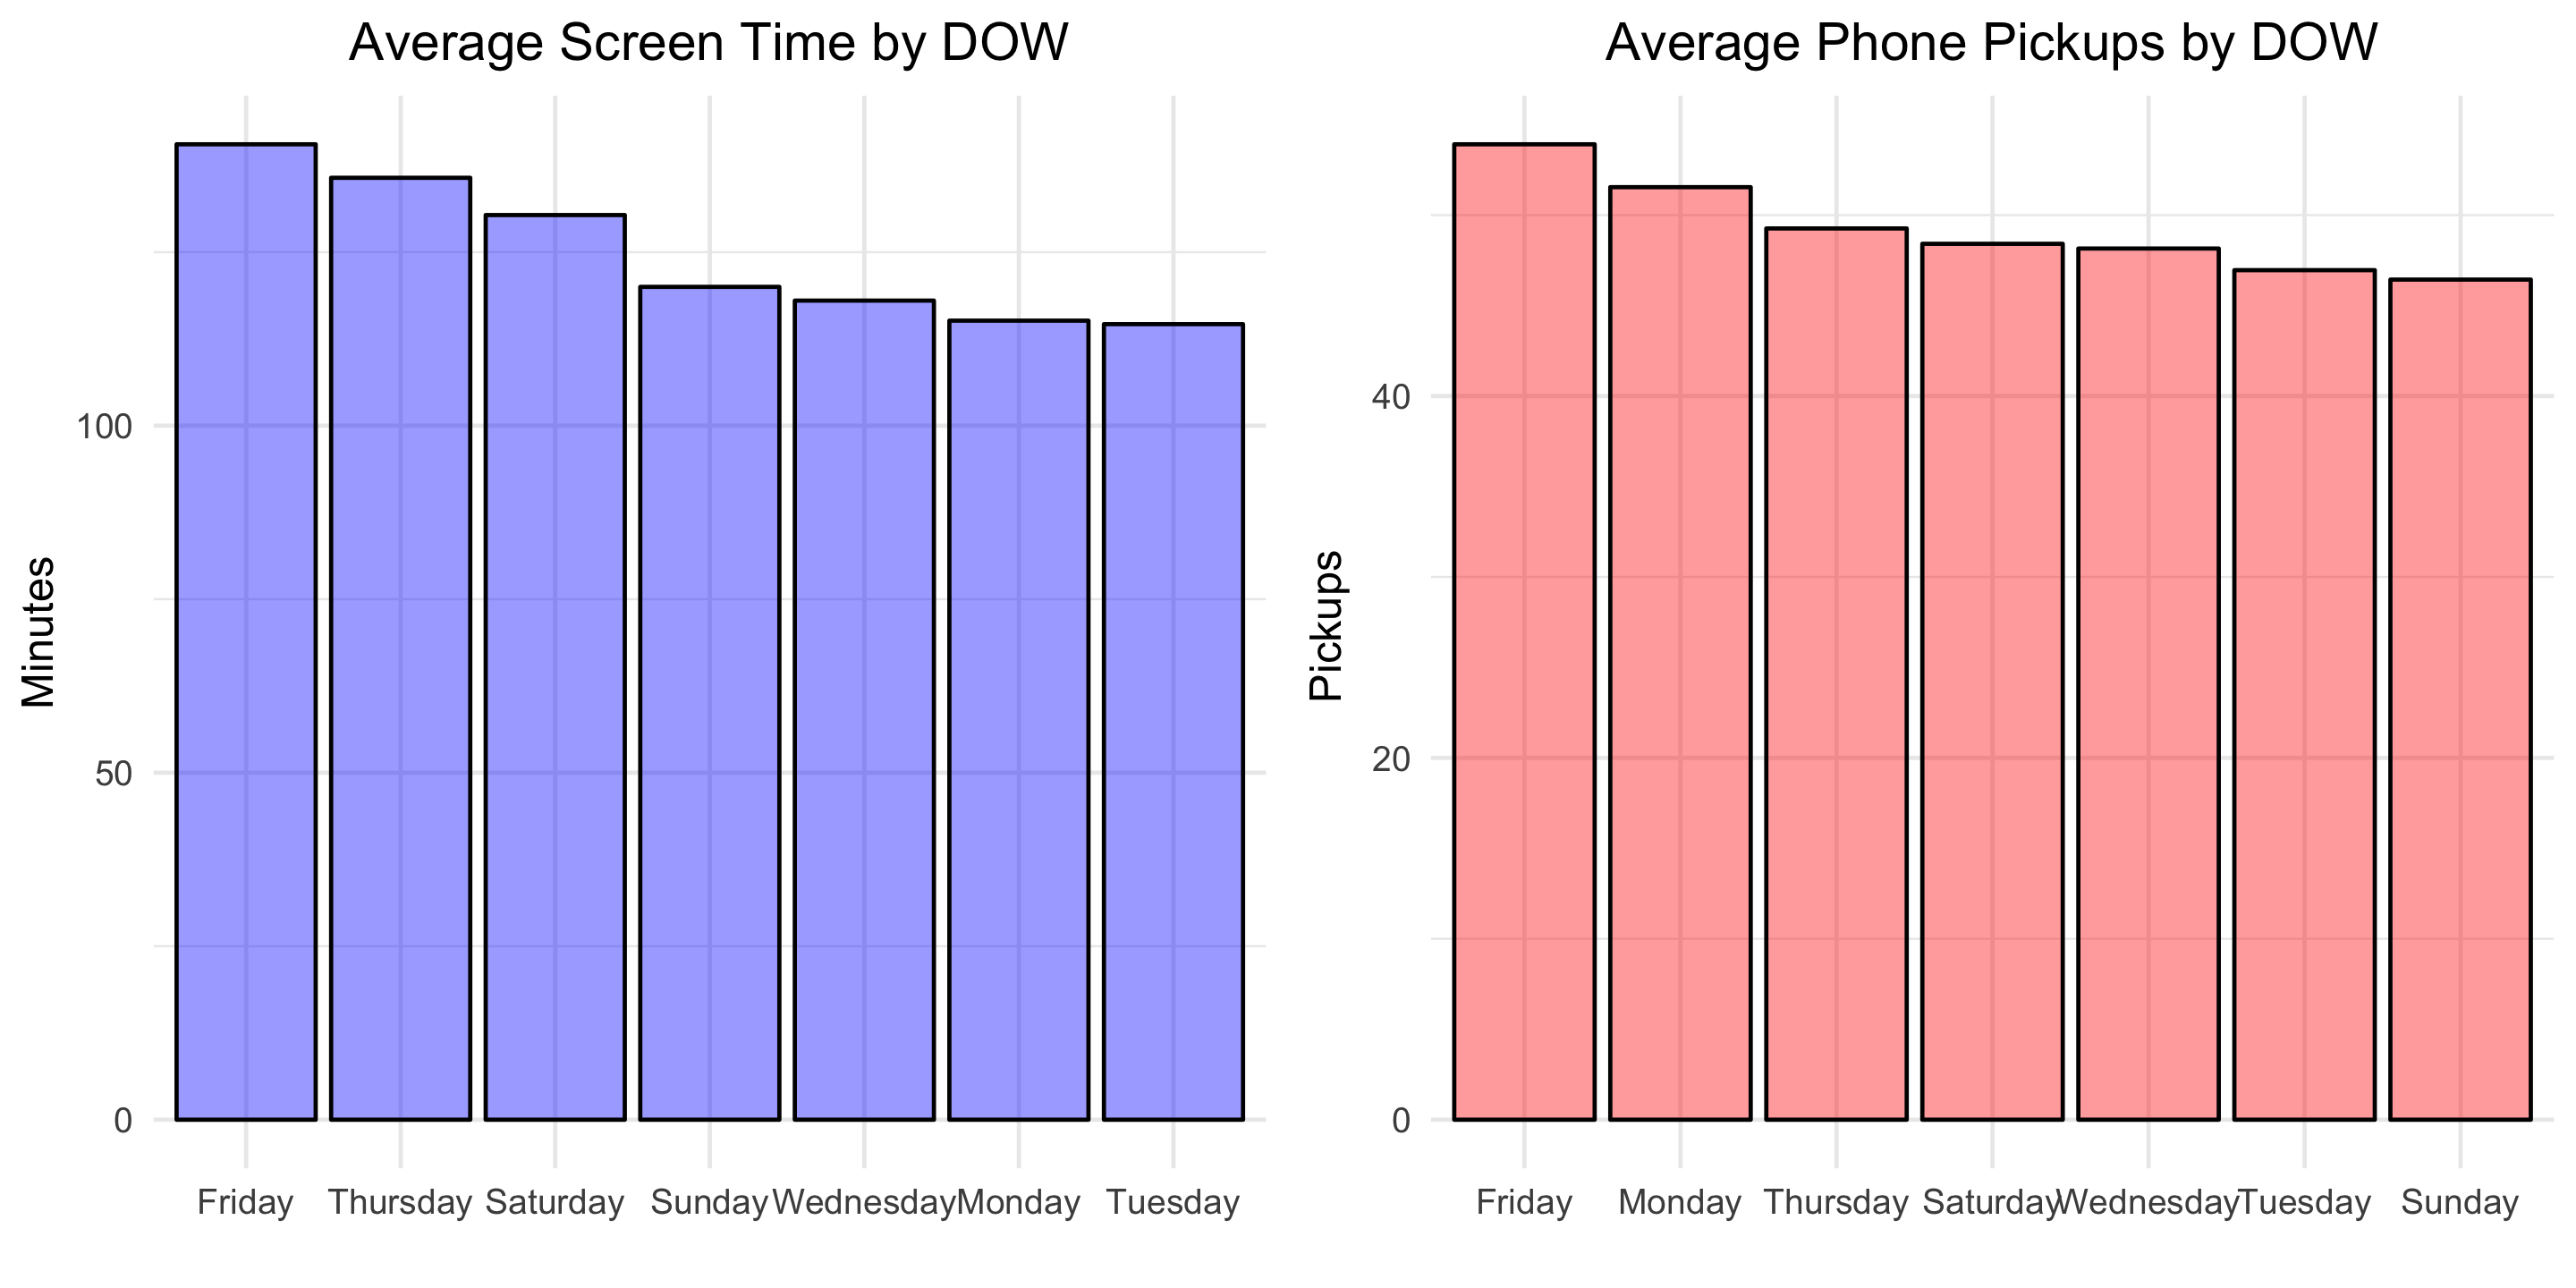
Finally, let’s see how our usage metrics vary by day of the week. We might suspect some variation since my weekday and weekend schedules are different.

byDOW <- moment %>%
  group_by(DOW) %>%
  summarise(avg_minute = mean(minuteCount),
            avg_pickup = mean(pickupCount)) %>%
  arrange(desc(avg_minute))

g10 <- ggplot(byDOW, aes(x = reorder(DOW, -avg_minute), y = avg_minute)) + 
  geom_bar(stat = "identity", alpha = .4, fill = "blue", colour="black") +
  labs(title = "Average Screen Time by DOW",
       x = "",
       y = "Minutes") +
  theme_minimal() +
  theme(plot.title = element_text(hjust = 0.5))

g11 <- ggplot(byDOW, aes(x = reorder(DOW, -avg_pickup), y = avg_pickup)) + 
  geom_bar(stat = "identity", alpha = .4, fill = "red", colour="black") +
  labs(title = "Average Phone Pickups by DOW",
       x = "",
       y = " Pickups") +
  theme_minimal() +
  theme(plot.title = element_text(hjust = 0.5))

grid.arrange(g10, g11, ncol=2)

Looks like self-control slips in preparation for the weekend! Friday is the day with the greatest average screen time and average phone pickups.

Modeling

To finish, let’s fit a basic linear model to explore the relationship between phone pickups and screen-time minutes.

fit <- lm(minuteCount ~ pickupCount, data = moment)
summary(fit)

Below is the output:

Coefficients:
            Estimate Std. Error t value Pr(>|t|)    
(Intercept)  39.9676     9.4060   4.249 2.82e-05 ***
pickupCount   1.7252     0.1824   9.457  < 2e-16 ***
---
Signif. codes:  0 ‘***’ 0.001 ‘**’ 0.01 ‘*’ 0.05 ‘.’ 0.1 ‘ ’ 1

Residual standard error: 50.07 on 320 degrees of freedom
Multiple R-squared:  0.2184,	Adjusted R-squared:  0.216 
F-statistic: 89.43 on 1 and 320 DF,  p-value: < 2.2e-16

This means that, on average, each additional phone pickup results in 1.7 minutes of screen time. Let’s visualize the model fit.

g13 <- ggplot(moment, aes(x = pickupCount, y = minuteCount)) + 
  geom_point(alpha = .6) + 
  geom_smooth(method = 'lm', formula = y ~ x, se = FALSE) +
  #geom_bar(stat = "identity", alpha = .4, fill = "blue", colour="black") +
  labs(title = "Minutes of Screen Time vs Phone Pickups",
       x = "Phone Pickups",
       y = "Minutes of Screen Time") +
  theme_minimal() +
  theme(plot.title = element_text(hjust = 0.5))

You can find all the code used in this post here. Download your own Moment data, point the R script towards the file, and Voila, two dashboard-type images like the one below will be produced for your personal enjoyment.

What other questions would you answer?

css.php