I’m constantly thinking about how to capture and analyze data from day-to-day life. One data source I’ve written about previously is Moment, an iPhone app that tracks screen time and phone pickups. Under the advanced settings, the app offers data export (via JSON file) for nerds like me.
Here we’ll step through a basic analysis of my usage data using R. To replicate this analysis with your own data, fork this code and point the directory to your ‘moment.json’ file.
Cleaning + Feature Engineering
We’ll start by calling the “rjson” library and bringing in the JSON file.
library("rjson")
json_file = "/Users/erikgregorywebb/Downloads/moment.json"
json_data <- fromJSON(file=json_file)
Because of the structure of the file, we need to “unlist” each day and then combine them into a single data frame. We’ll then add column names and ensure the variables are of the correct data type and format.
df <- lapply(json_data, function(days) # Loop through each "day"
{data.frame(matrix(unlist(days), ncol=3, byrow=T))})

# Connect the list of dataframes together in one single dataframe
moment <- do.call(rbind, df)

# Add column names, remove row names
colnames(moment) <- c("minuteCount", "pickupCount", "Date")
rownames(moment) <- NULL

# Correctly format variables
moment$minuteCount <- as.numeric(as.character(moment$minuteCount))
moment$pickupCount <- as.numeric(as.character(moment$pickupCount))
moment$Date <- substr(moment$Date, 0, 10)
moment$Date <- as.Date(moment$Date, "%Y-%m-%d")
Let’s create a feature to enrich our analysis later on. A base function in R called “weekdays” quickly extracts the weekday, month or quarter of a date object.
moment$DOW <- weekdays(moment$Date)
moment$DOW <- as.factor(moment$DOW)
With the data cleaning and feature engineering complete, the data frame looks like this:
| Minute Count | Pickup Count | Date | DOW |
|---|---|---|---|
| 131 | 54 | 2018-06-16 | Saturday |
| 53 | 46 | 2018-06-15 | Friday |
| 195 | 64 | 2018-06-14 | Thursday |
| 91 | 52 | 2018-06-13 | Wednesday |
For clarity, the minute count refers to the number of minutes of “screen time.” If the screen is off, Moment doesn’t count listening to music or talking on the phone. What about a pickup? Moment’s FAQs define a pickup as each separate time you turn on your phone screen. For example, if you pull your phone out of your pocket, respond to a text, then put it back, that counts as one pickup.
With those feature definitions clarified, let’s move to the fun part: visualization and modeling!
Visualization
I think good questions bring out the best visualizations so let’s start by thinking of some questions we can answer about my iPhone usage:
- What do the distributions of minutes and pickups look like?
- How does the number of minutes and pickups trend over time?
- What’s the relationship between minutes and pickups?
- Does the average number of minutes and pickups vary by weekday?
Let’s start with the first question, arranging the two distributions side by side.
g1 <- ggplot(moment, aes(x = minuteCount)) +
  geom_density(alpha=.2, fill="blue") +
  labs(title = "Screen Time Minutes",
       x = "Minutes",
       y = "Density") +
  theme_minimal() +
  theme(plot.title = element_text(hjust = 0.5))

g2 <- ggplot(moment, aes(x = pickupCount)) +
  geom_density(alpha=.2, fill="red") +
  labs(title = "Phone Pickups",
       x = "Pickups",
       y = "Density") +
  theme_minimal() +
  theme(plot.title = element_text(hjust = 0.5))

grid.arrange(g1, g2, ncol=2)
On average, it looks like I spend about 120 minutes (2 hours) on my phone with about 50 pickups. Check out that screen time minutes outlier; I can’t remember spending 500+ minutes (8 hours) on my phone!
Next, how does my usage trend over time?
g4 <- ggplot(moment, aes(x = Date, y = minuteCount)) +
  geom_line() +
  geom_smooth(se = FALSE) +
  labs(title = "Screen Minutes Over Time ",
       x = "Date",
       y = "Minutes") +
  theme_minimal() +
  theme(plot.title = element_text(hjust = 0.5))

g5 <- ggplot(moment, aes(x = Date, y = pickupCount)) +
  geom_line() +
  geom_smooth(se = FALSE) +
  labs(title = "Phone Pickups Over Time ",
       x = "Date",
       y = "Pickups") +
  theme_minimal() +
  theme(plot.title = element_text(hjust = 0.5))

grid.arrange(g4, g5, nrow=2)
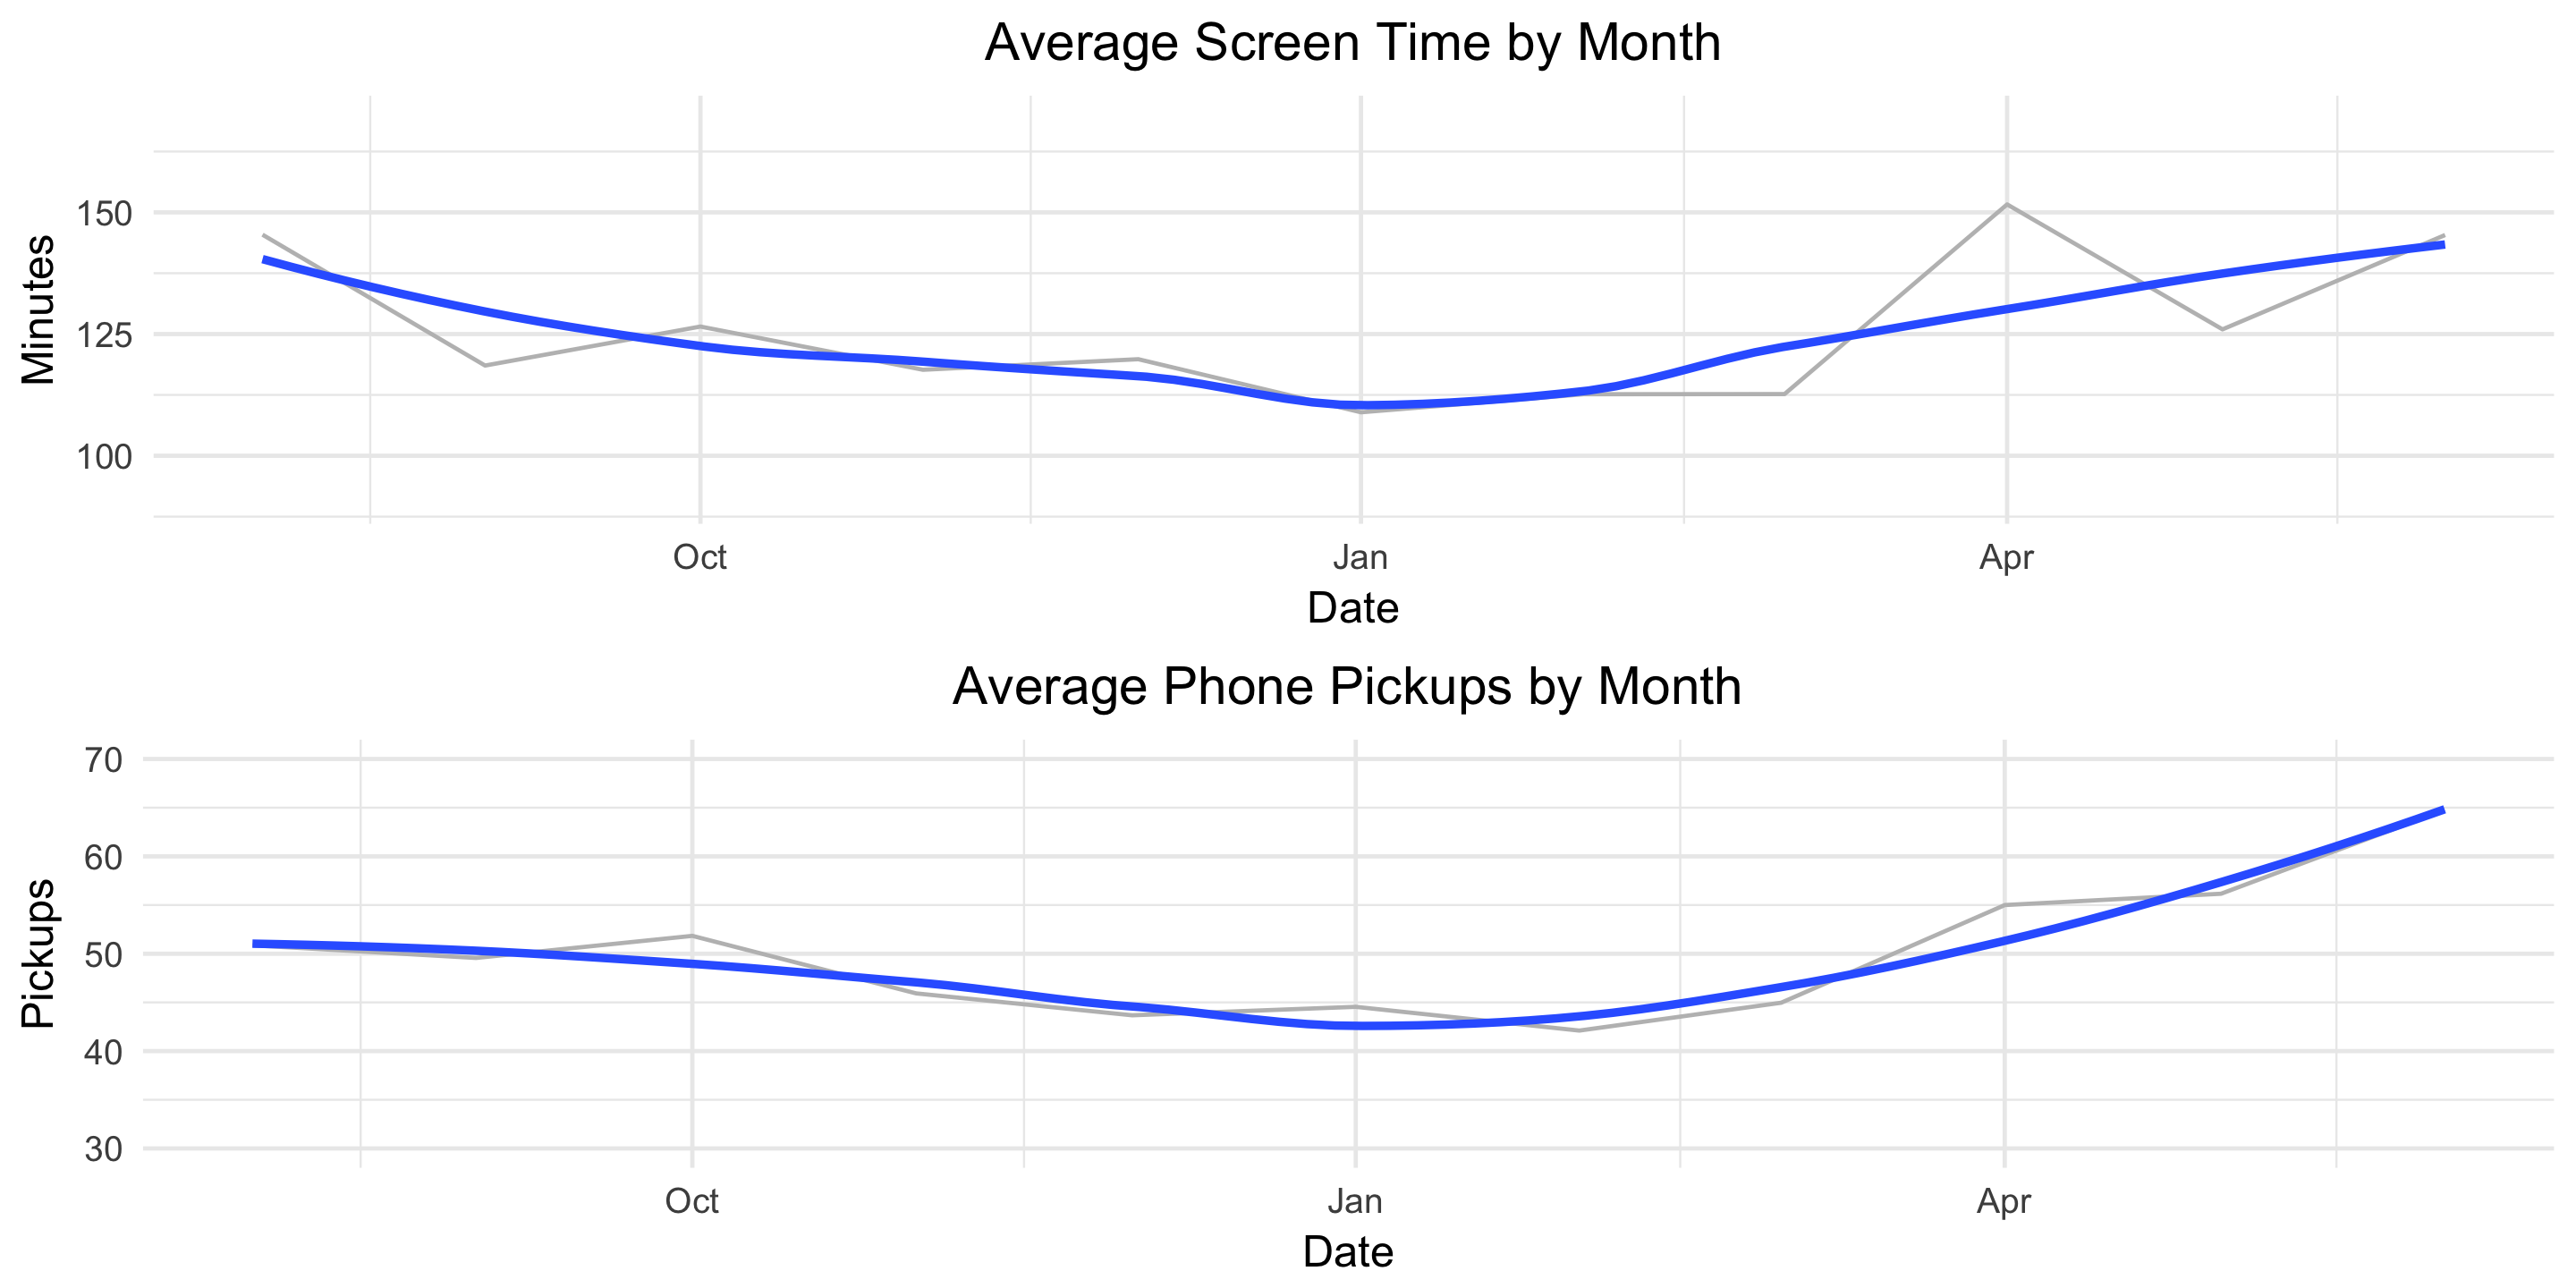
Screen time appears fairly constant over time but there’s an upward trend in the number of pickups starting in late March. Let’s remove some of the noise and plot these two metrics by month.
moment$monyr <- as.factor(paste(format(moment$Date, "%Y"), format(moment$Date, "%m"), "01", sep = "-"))

bymonth <- moment %>%
  group_by(monyr) %>%
  summarise(avg_minute = mean(minuteCount),
            avg_pickup = mean(pickupCount)) %>%
  filter(avg_minute > 50) %>% # used to remove the outlier for July 2017
  arrange(monyr)

bymonth$monyr <- as.Date(as.character(bymonth$monyr), "%Y-%m-%d")
g7 <- ggplot(bymonth, aes(x = monyr, y = avg_minute)) +
  geom_line(col = "grey") +
  geom_smooth(se = FALSE) +
  ylim(90, 170) +
  labs(title = "Average Screen Time by Month",
       x = "Date",
       y = "Minutes") +
  theme_minimal() +
  theme(plot.title = element_text(hjust = 0.5))

g8 <- ggplot(bymonth, aes(x = monyr, y = avg_pickup)) +
  geom_line(col = "grey") +
  geom_smooth(se = FALSE) +
  ylim(30, 70) +
  labs(title = "Average Phone Pickups by Month",
       x = "Date",
       y = "Pickups") +
  theme_minimal() +
  theme(plot.title = element_text(hjust = 0.5))

grid.arrange(g7, g8, nrow=2)
This helps the true pattern emerge. The average values are plotted in light grey and overlayed with a blue, smoothed line. Here we see a clear decline in both screen-time minutes and pickups from August until January and then a clear increase from January until June.
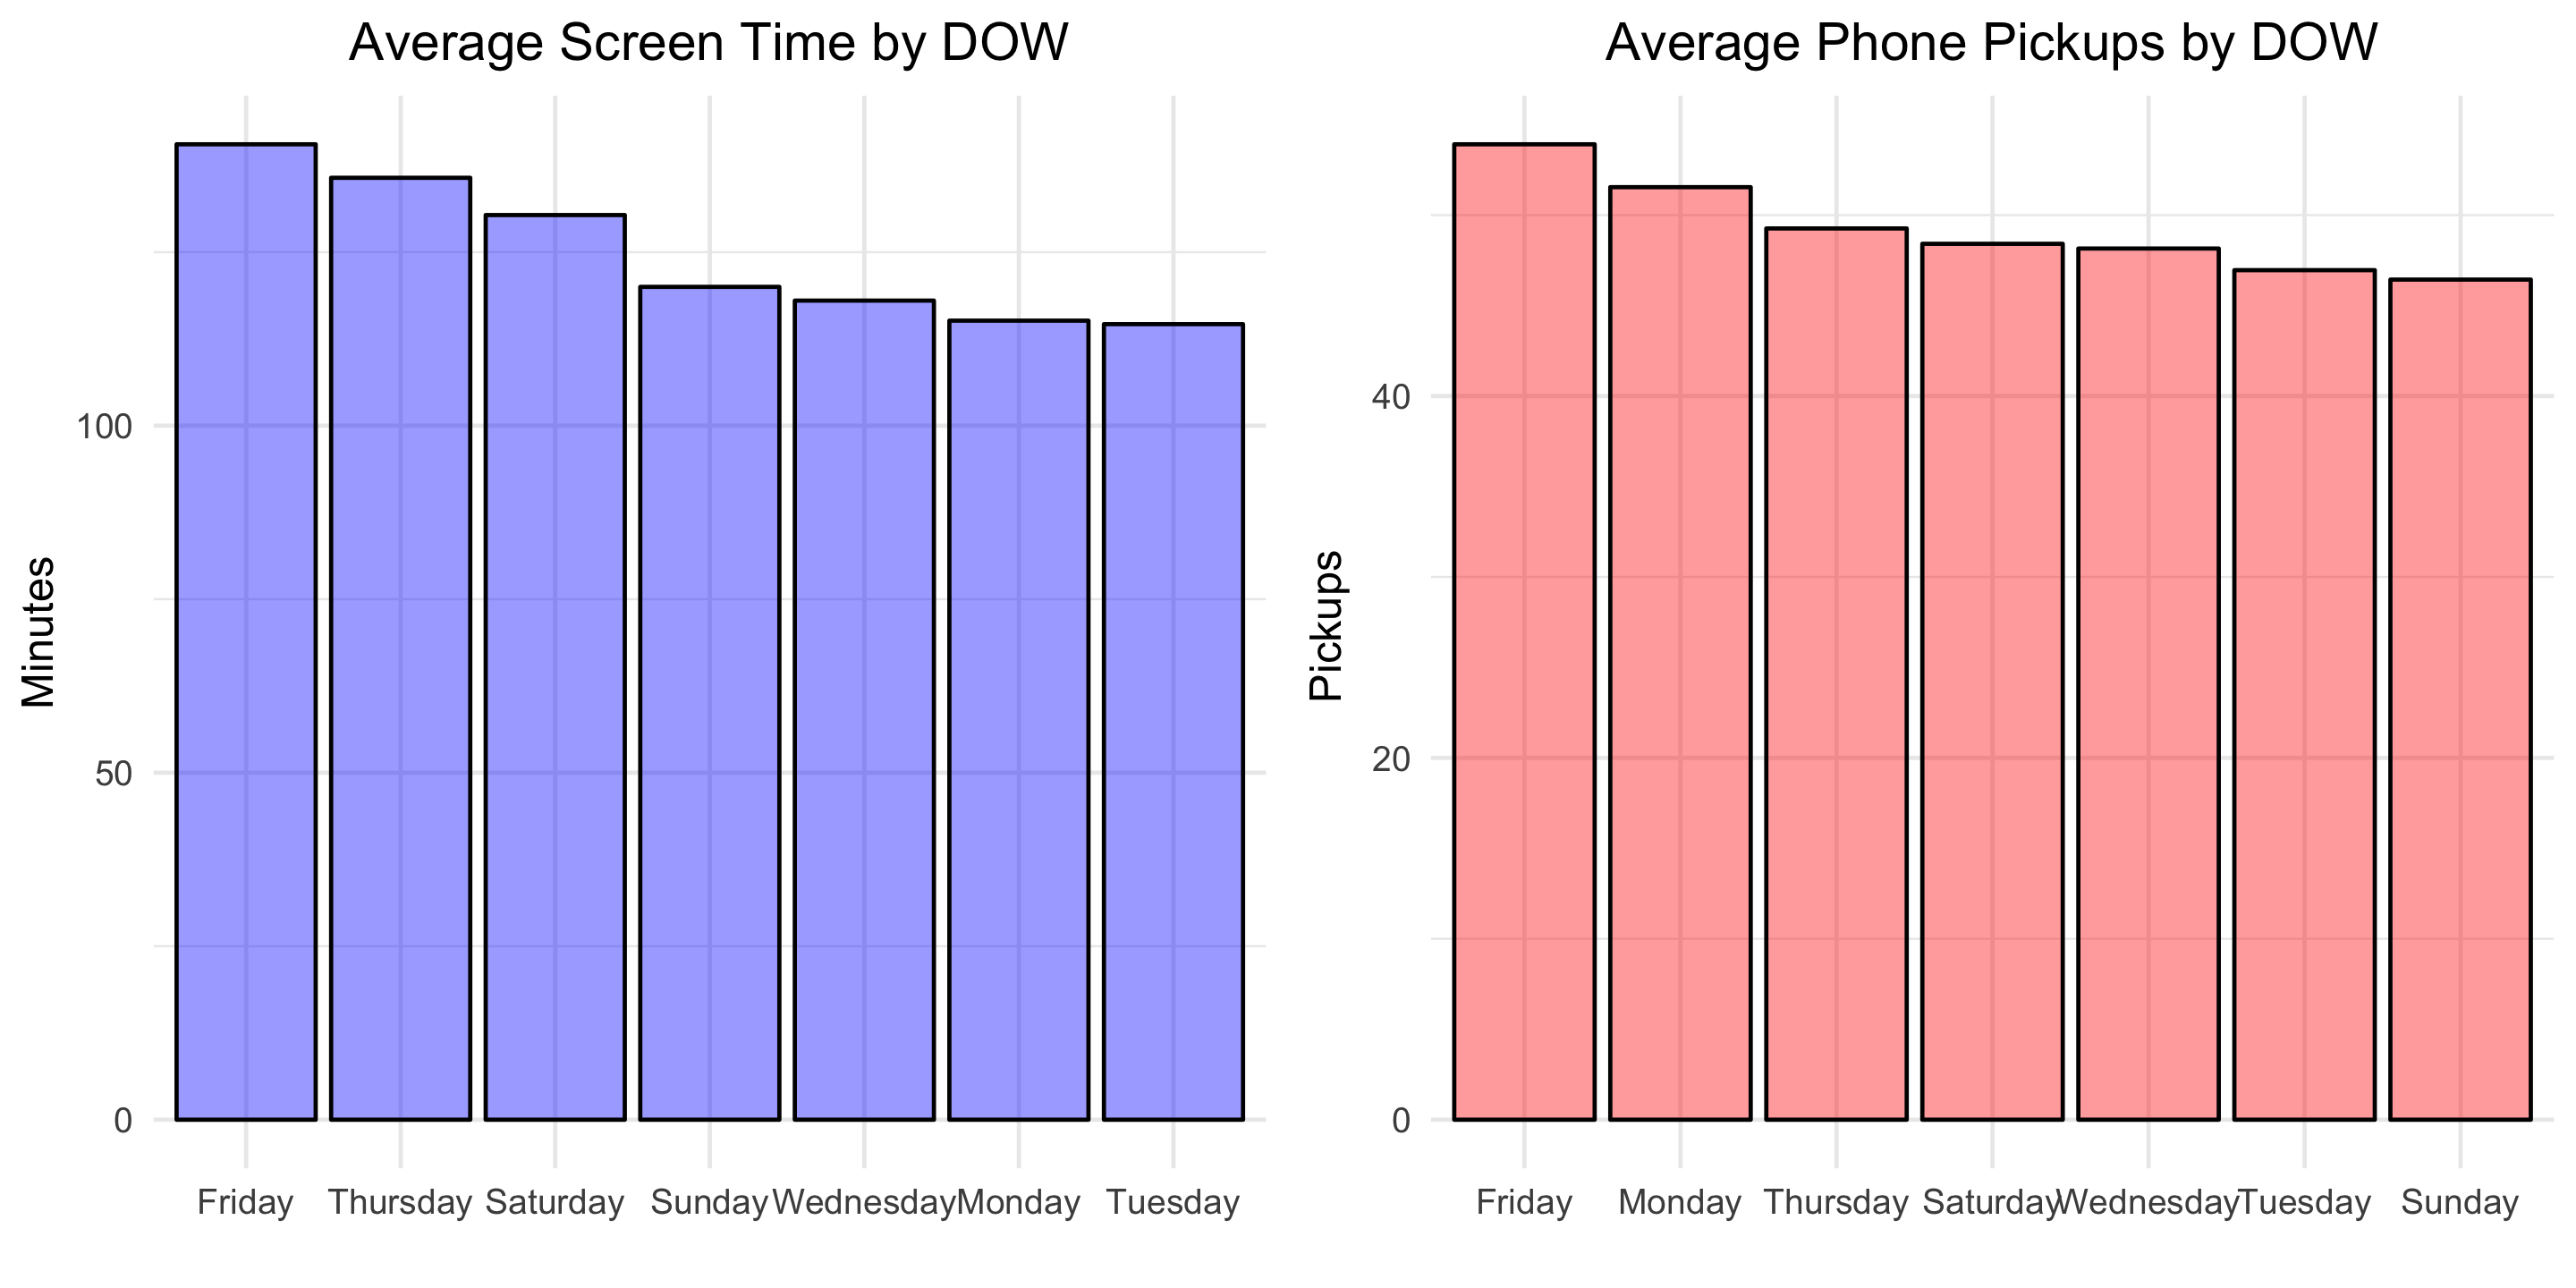
Finally, let’s see how our usage metrics vary by day of the week. We might suspect some variation since my weekday and weekend schedules are different.
byDOW <- moment %>%
  group_by(DOW) %>%
  summarise(avg_minute = mean(minuteCount),
            avg_pickup = mean(pickupCount)) %>%
  arrange(desc(avg_minute))

g10 <- ggplot(byDOW, aes(x = reorder(DOW, -avg_minute), y = avg_minute)) +
  geom_bar(stat = "identity", alpha = .4, fill = "blue", colour="black") +
  labs(title = "Average Screen Time by DOW",
       x = "",
       y = "Minutes") +
  theme_minimal() +
  theme(plot.title = element_text(hjust = 0.5))

g11 <- ggplot(byDOW, aes(x = reorder(DOW, -avg_pickup), y = avg_pickup)) +
  geom_bar(stat = "identity", alpha = .4, fill = "red", colour="black") +
  labs(title = "Average Phone Pickups by DOW",
       x = "",
       y = " Pickups") +
  theme_minimal() +
  theme(plot.title = element_text(hjust = 0.5))

grid.arrange(g10, g11, ncol=2)
Looks like self-control slips in preparation for the weekend! Friday is the day with the greatest average screen time and average phone pickups.
Modeling
To finish, let’s fit a basic linear model to explore the relationship between phone pickups and screen-time minutes.
fit <- lm(minuteCount ~ pickupCount, data = moment)
summary(fit)
Below is the output:
Coefficients:
            Estimate Std. Error t value Pr(>|t|)
(Intercept)  39.9676     9.4060   4.249 2.82e-05 ***
pickupCount   1.7252     0.1824   9.457  < 2e-16 ***
---
Signif. codes:  0 ‘***’ 0.001 ‘**’ 0.01 ‘*’ 0.05 ‘.’ 0.1 ‘ ’ 1

Residual standard error: 50.07 on 320 degrees of freedom
Multiple R-squared:  0.2184,	Adjusted R-squared:  0.216
F-statistic: 89.43 on 1 and 320 DF,  p-value: < 2.2e-16
This means that, on average, each additional phone pickup results in 1.7 minutes of screen time. Let’s visualize the model fit.
g13 <- ggplot(moment, aes(x = pickupCount, y = minuteCount)) +
  geom_point(alpha = .6) +
  geom_smooth(method = 'lm', formula = y ~ x, se = FALSE) +
  #geom_bar(stat = "identity", alpha = .4, fill = "blue", colour="black") +
  labs(title = "Minutes of Screen Time vs Phone Pickups",
       x = "Phone Pickups",
       y = "Minutes of Screen Time") +
  theme_minimal() +
  theme(plot.title = element_text(hjust = 0.5))
You can find all the code used in this post here. Download your own Moment data, point the R script towards the file, and Voila, two dashboard-type images like the one below will be produced for your personal enjoyment.
What other questions would you answer?


