Even though it’s been around for years, I just recently discovered Shark Tank, the show where hopeful entrepreneurs pitch business ideas to a panel of wealthy investors, or “sharks”. I usually wonder if there’s a method to the deal-making madness, especially when a pitch that resonates with me falls flat on the sharks.
In this post, I take my fandom to a deeper level by using episode descriptions from Wikipedia to understand what kinds of pitches have the highest chance of being offered a deal. In the process, I’ll use tools like web scraping, natural language processing, and API calls to gather, transform, enhance, and visual the data.
I’ve divided my workflow for this project into four steps:
- Obtain episode-level descriptions via web scraping
- Reshape data from episode-level to pitch-level
- Enhance data by categorizing descriptions via uClassify API
- Visualize key trends by season and pitch categories

1. Obtain episode-level descriptions via web scraping
This analysis is possible because of a Wikipedia page that contains short descriptions of every pitch delivered on Shark Tank.
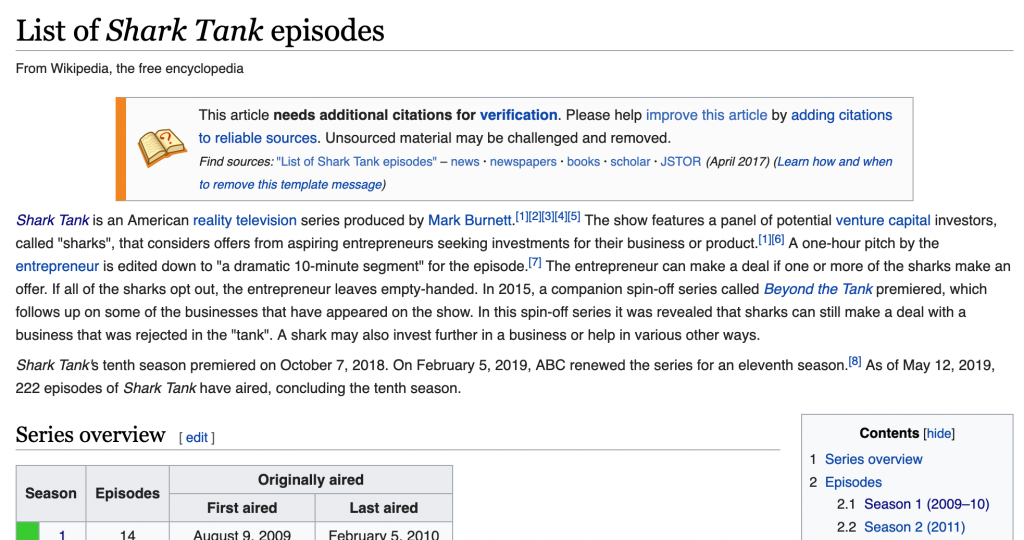
The first step is to extract this information via the rvest package in R, looping over each of the nine tables (corresponding to nine seasons) within the page.
Next we’ll do a bit of cleaning, simplifying column naming conventions, and adjusting the data types for the air date and viewership fields.
2. Reshape data from episode-level to pitch-level
In its current form, we won’t be able to detect any patterns with this data since the descriptions are bundled at the episode-level, like this:
“Crooked Jaw” a mixed martial arts clothing line (NO); “Lifebelt” a device that prevents the car from starting without the seat belt being fastened (NO); “A Perfect Pear” a gourmet food business (YES);
We need to “un-nest” the descriptions so that each row contains a single pitch. This is easily accomplished using the unnest function from tidyr.
Now we have a clean dataset, ready to enhance and analyze. Here’s a sample of the data structure, highlighting a few variables:
| no_overall | pitch_description | deal |
|---|---|---|
| 1 | a pie company | YES |
| 2 | an implantable Bluetooth device requiring surgery to insert the device into the user's head | NO |
| 3 | an electronic hand-held device for waiting rooms | NO |
| 4 | a plastic elephant-shaped device that helps parents give small children oral medicine | YES |
| 5 | a packing and organizing service based on an already successful business called College Hunks Hauling Junk | NO |
| 6 | a mixed martial arts clothing line | NO |
| 7 | a device that prevents the car from starting without the seat belt being fastened | NO |
| 8 | a gourmet food business | YES |
| 9 | a Post-It note arm for laptops | NO |
| 10 | a musical way to teach students Shakespeare | YES |
3. Enhance data by categorizing descriptions via API
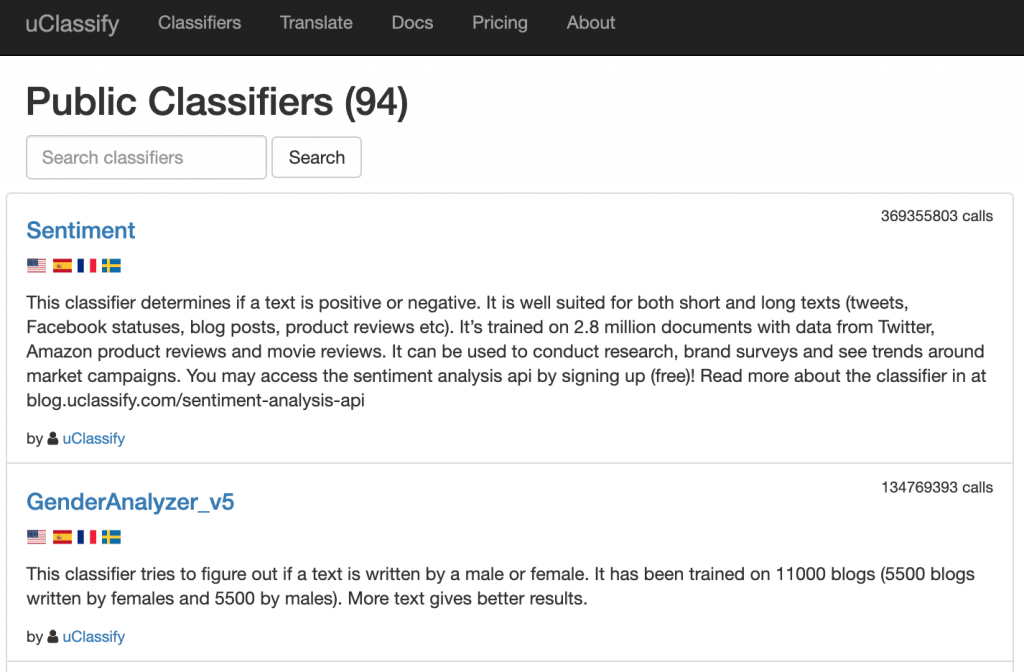
How can we systematically analyze what kind of pitches are more likely to be offered a deal when all we have is a brief text description? Rather than build my own NLP model from scratch to categorize pitches, I used uClassify, which offers “Classification as a Service” (CAAS).
Much like Google Cloud’s Natural Language API, uClassify provides on-demand NLP services via API. To categorize the Shark Tank pitches, I used the free “Topics” and “Business Topics” classifiers.
Let’s see how this was implemented in the R code:
These functions construct a URL with my personal API key, the classifier API name, and the text (pitch description) to be categorized. A GET call then returns a JSON with a list of categories and “match” scores.
For example, take pitch #803, “Thrive+”, which has this description: “capsules that reduce alcohol’s negative effects.” The category with the highest “match” score was Health, followed closely by Science. By categorizing the pitch descriptions, we’ll be more equipped to uncover some key elements of successful Shark Tank pitches.
4. Visualize key trends by season and pitch categories
Now for the fun part! After compiling, cleaning, and enhancing our dataset, we’re ready to visualize and model the data. First, let’s take a look at Shark Tank’s popularity over time, measured in TV viewership (in millions).

Even without the fitted line, it’s easy to see a rise and fall in popularity, with the peak around 2015 with 7.5 million viewers. Next, let’s look at how willing sharks were to make deals over the course of the show, across nine seasons:
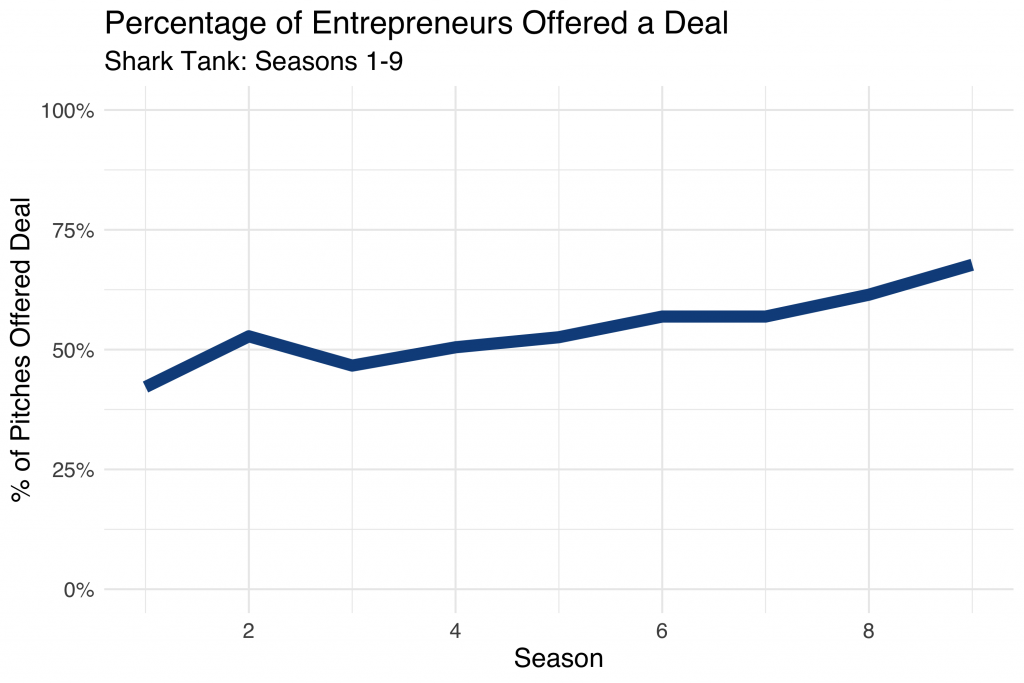
During Season 1, less than 50% of pitches were offered a deal from the sharks. By season 9, deals were made over 65% of the time! I wonder if this had anything to do with sliding viewership.
Let’s dig a bit deeper and start looking at characteristics of successful pitches. Using the tidytext methodology, I determined which words within the pitch descriptions were most often associated with a strong response from the sharks (for better or worse).
| Word | Deal | No Deal | Net |
|---|---|---|---|
| clothing | 7 | 15 | -8 |
| portable | 10 | 3 | +7 |
| bags | 7 | 1 | +6 |
| cooking | 7 | 1 | +6 |
| designed | 16 | 10 | +6 |
| ice | 1 | 7 | -6 |
| car | 6 | 1 | +5 |
| cleaning | 6 | 1 | +5 |
| hair | 11 | 6 | +5 |
| healthy | 5 | 0 | +5 |
Clothing is mentioned in 22 pitch descriptions, 70% of which were unsuccessful! On the flip side, when the pitch included something “portable”, the sharks were willing to make a deal 10 out of 13 times. If you make it onto Shark Tank, don’t mention ice! For whatever reason, almost 90% of those pitches resulted in no deal with the sharks.
Now let’s see what else we can learn by using the categories generated from the uClassify API classifiers:
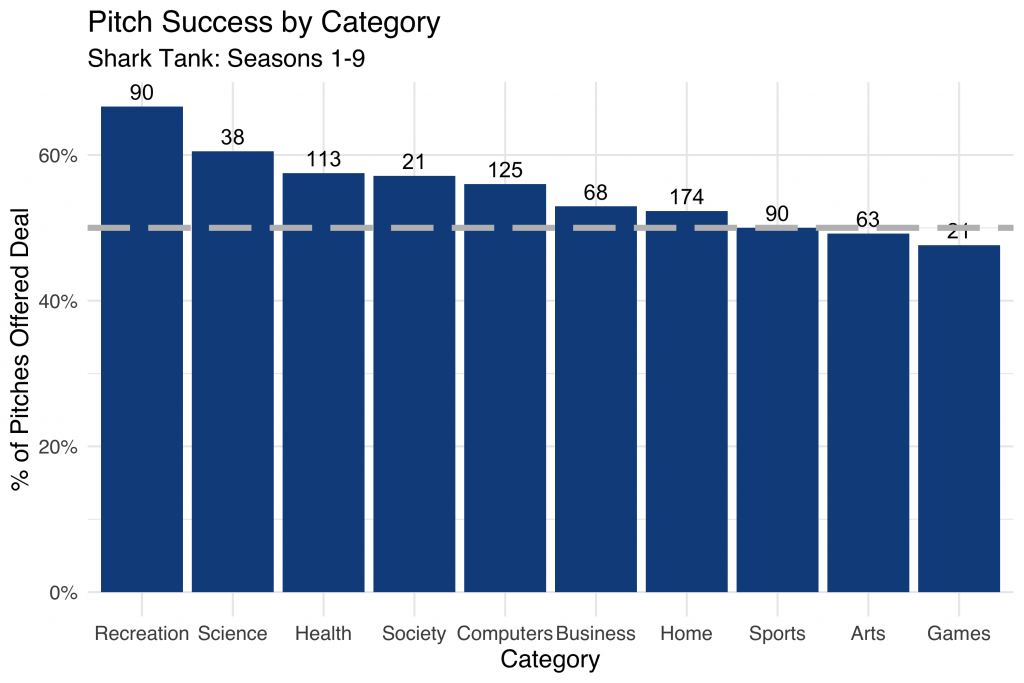
Here we summarize pitch success by category, with the total number of pitches within the category represented above each bar. The dashed grey line represents the 50% cutoff, where a pitch within a given category is equally likely to be accepted or rejected.
Notice how over 65% of deals classified as “Recreation” were offered a deal by the sharks over the course of the nine seasons. It looks like “Game” entrepreneurs didn’t snag funding quite as easily!
Conclusion
This has been a fun and quick way to explore some of the nuance in the world of Shark Tank deal-making. Truthfully, the dataset we created was pretty limited. Adding in information like which shark (or sharks) made the deal, for how much, and for what percentage of equity would add more precision compared to simply knowing if a deal was made or not.
In addition, access to full pitch transcripts (rather than simplistic descriptions of ~10 words or less) would be much more helpful in accurately classifying the pitches into meaningful categories.
You can find the complete R code here and the final dataset here, both hosted on GitHub. Thanks for reading!
