How to build a simple mobile app in 30 minutes or less

A few weeks ago I took a GRE practice test to gauge how much preparation I’d need before officially taking the exam. The scores revealed a skill gap, especially in the Verbal Reasoning section. To do well, it turns out you need a pretty robust and sophisticated vocabulary. 💡

With that insight, it was apparent I needed a way to log unfamiliar words to expand my vocabulary. I hoped to automate the process of inputting word definitions. Combining the power of Google Sheets, Glide, and Rapid API, I built a simple mobile app to help level up my vocabulary-building efforts. Take it for a spin here!

App Components

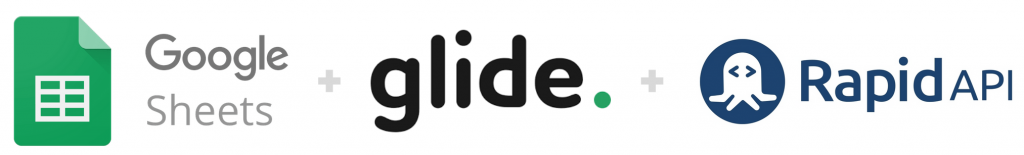
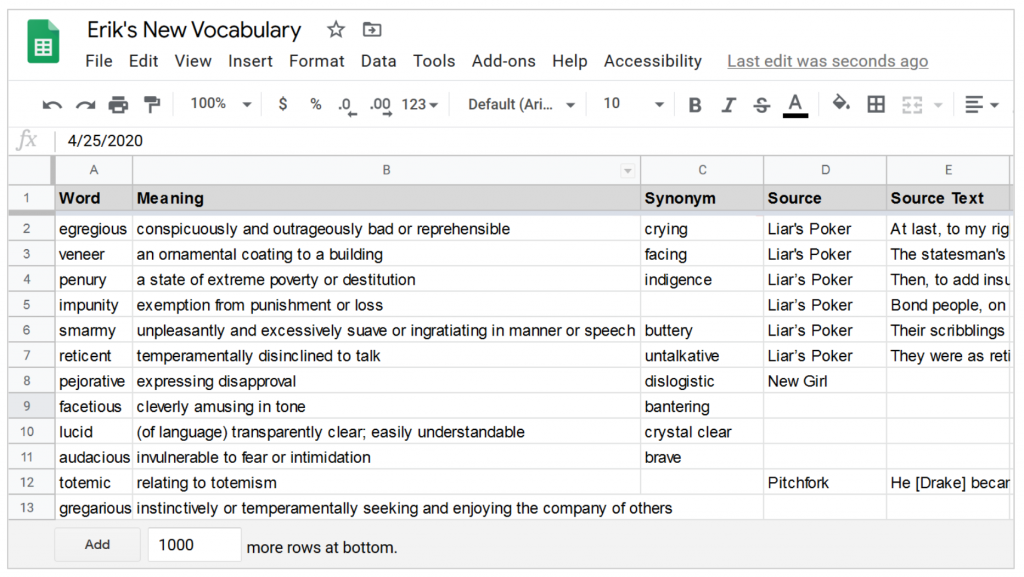
Google Sheets (Database): Spreadsheets are the most successful programming model of all time, and for small projects, a Google Sheet is a great database.

Google Sheets: The database

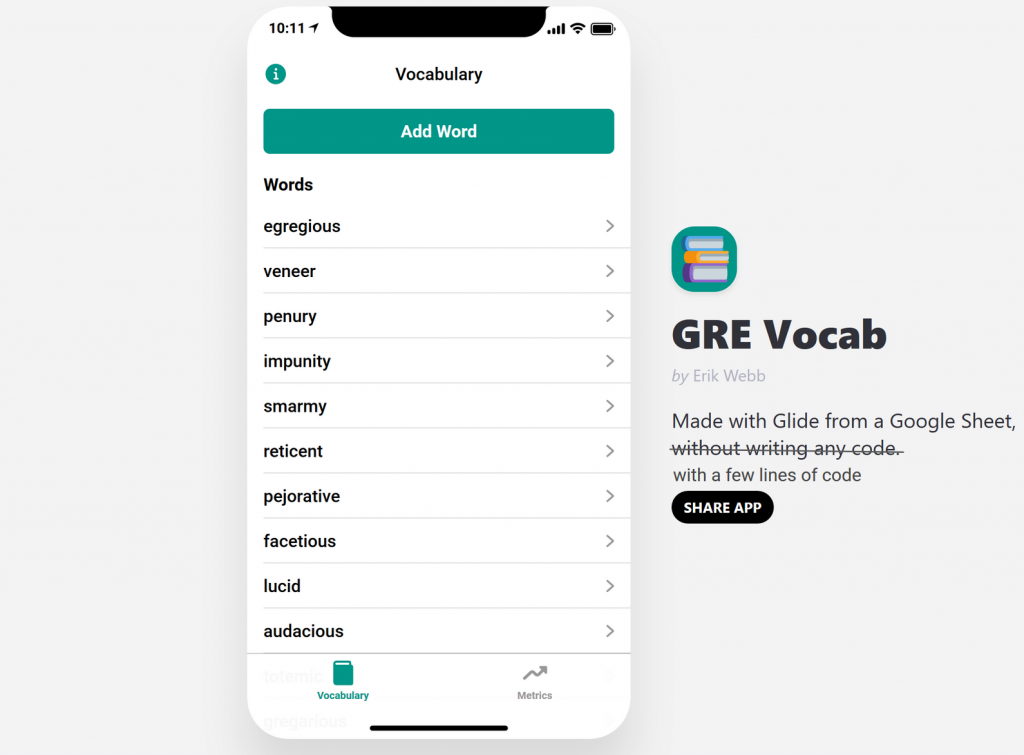
Glide (App UI): Glide allows you to build beautiful apps without any code using drag-and-drop building blocks. After connecting to the Google Sheet “back end”, it was easy to assemble a polished progressive web app that looks and feels like a native iOS app from the App Store.


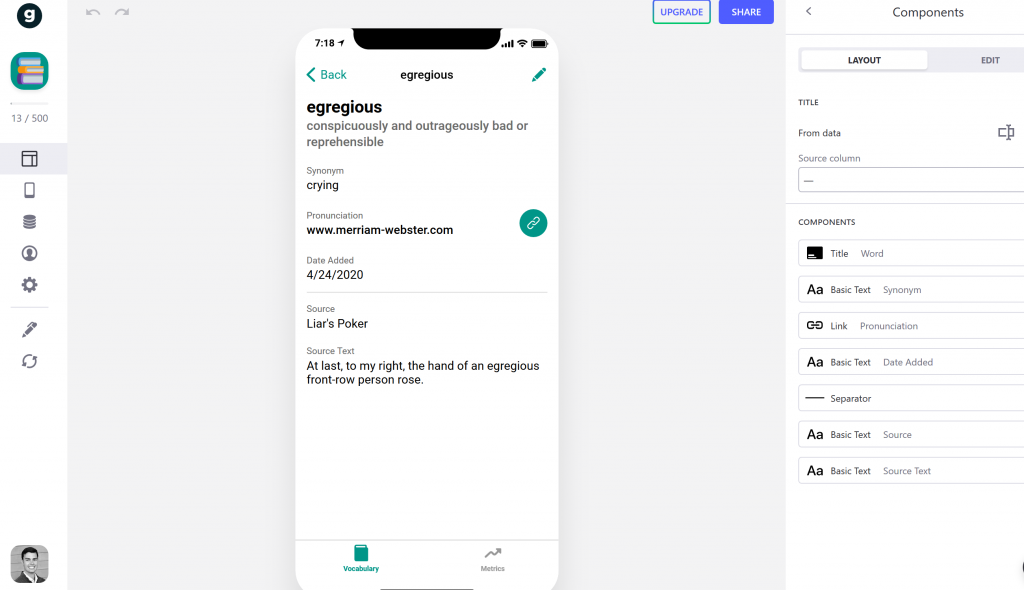
Glide: The app user interface

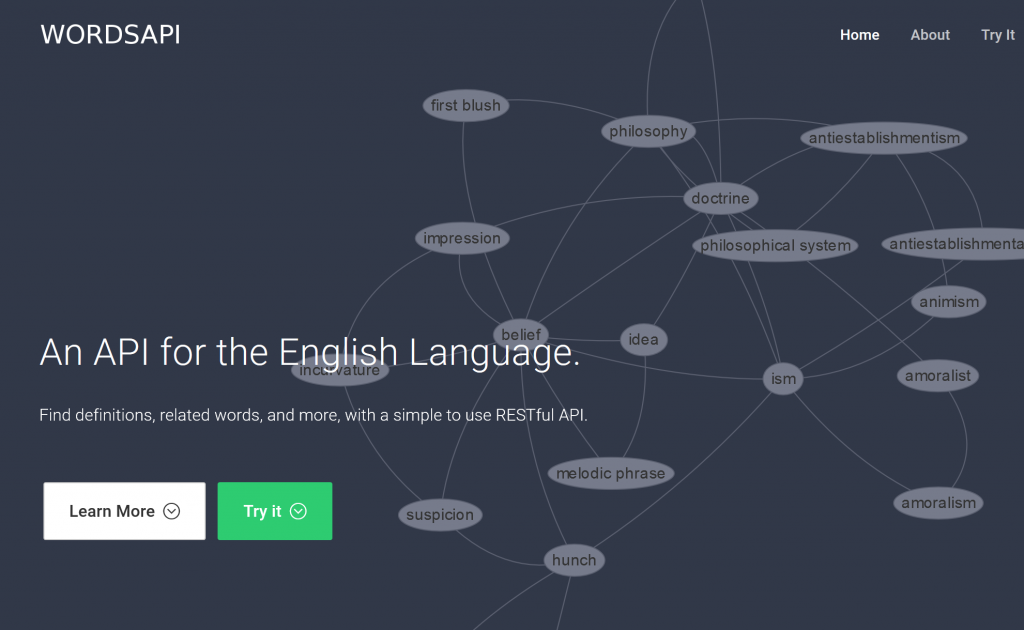
RapidAPI (The Dictionary API): To automate the process of sourcing word definitions and synonyms, I turned to the WordsAPI, available in the RapidAPI marketplace. The free tier includes 2,500 API calls a day.

RapidAPI / WordsAPI: the dictionary API

The cool part is that you can make external API calls in a Google Sheet via Apps Script (a scripting platform developed by Google for light-weight application development in the G Suite platform). This required a dabble in JavaScript, which was new to me as a heavy R/Python user.

The code is broken up into two functions:

  • wordsAPImakes a GET call to the WordsAPI and saves the response
  • getWordSynonym extracts the word definition from the JSON body

The best part is that once the code is saved in the App Scripts file, you can call the custom function directly in Google Sheets, just like a regular function:

=ARRAYFORMULA(getWordSynonym(A2:A))

With Google Sheets and Glide, together with WordsAPI, I was able to make the simple tool I needed to save, learn, and review new words in order to prepare for the GRE exam. It’s exciting to see new no-code/low-code platforms (i.e. Glide) being developed that make anyone a builder.

My GRE Vocab App: grevocab.glideapp.io
Underlying Google Sheet (View Only): Link
App Scripts JS Code: Link

Uncovering Insights via Google Sheets Query

The Google Sheets query function brings some of the power of SQL to spreadsheets. I recently discovered the power of this tool when building some personal finance dashboards. In this post, I’ll walk through three examples of the query function to explore a CrunchBase dataset of startup companies, which I found on Tableau’s resource page. To learn the basics of this function I’d recommend reading one of the following articles:

The CrunchBase dataset contains information about 49,000+ startups including the startup name, website, market, status, funding, and location. The most recent funding in this dataset occurred in early 2015. The data, as well as the query examples below, can be found in this Google Sheet.

Note: The query statement is formed using column letters. If I want to reference the “market” column I would refer to it as “E”, as shown below.

With that in mind, here’s a list of the variables we have to work with and their corresponding column letter in the Google Sheet.

  • A: permalink
  • B: name
  • C: homepage_url
  • D: category_list
  • E: market
  • F: status
  • G: funding_total_usd
  • H: country_code
  • I: state_code
  • J: region
  • K: city
  • L: funding_rounds
  • M: founded_at
  • N: founded_month
  • O: founded_quarter
  • P: founded_year
  • Q: first_funding_at
  • R: last_funding_at
  • S: time_to_funding

In the examples below I’ll share the query, a visualization, and a brief explanation. Let’s jump into it!

1. Number of Startups by State

select I, count(A) where (H = 'USA' and I <> '') group by I order by count(A) desc label I 'State', count(A) 'Number of Startups'

As expected, California is home to by far the largest number of startups. New York trails in distant second with less than a third as many startups as California.

2. Number of CA & NY Startups Over Time

select P, count(P) where ((I = 'NY' or I = 'CA') and P > 1989 and P < 2014) group by P pivot I label P 'Year'

Has California always held the lead over New York? This query allows us to compare the number of startups founded overtime in the two states.

It appears that California has been in the lead for some time!

3. Total Funding by Market

select E, sum(G), count(G) where E <> '' group by E order by sum(G) desc label E 'Market', sum(G) 'Total Funding', count(G) 'Number of Startups'

Pro-tip for aspiring entrepreneurs: consider Biotechnology! With a staggering total of 73+ billion in funding, this market is by far the largest in this dataset.

There’s so much more to dig into with this dataset. What other things would you explore? How would you translate them into a query?

css.php