
To comply with firm policy, this post has been removed.
Tag: tidyverse

Visualizing Pocket Articles with R
Every day I see dozens of things online I don’t have time to read or view in the moment. With Pocket I save news articles, blog posts, talks, or tutorials for later viewing. Pocket allows me to organize things I’ve saved with tags and eliminates the need to send links to myself or bookmark web pages.

Pocket downloads the content for offline reading and presents the text in a reader mode free of ads. I usually save several articles a day and then read them on my commute home out of the city. Simply said, Pocket is the best way to store and catalog anything you read on your phone or computer.
Over the last 2 years I’ve saved just shy of 2,000 links, encompassing a variety of content. Luckily, Pocket has a handy export interface, generating an HTML file with a list of saved links. In this post I’ll extract insights from these links in R, using link domain and topic frequency to assess my interests.
Getting Started
To start, let’s call the required packages.
As an overview, I use rvest to extract the HTML page content, urltools to transform the links to a working dataset, dplyr to manipulate the data, tidytext to tokenzen the link content, stringr to filter out numbers from the links, and wordcloud2 to visualize the word frequencies.
Next, I import the HTML file and extract the links. The url_parse function easily transforms the list of links into a data frame, with columns like scheme, domain, and path. For example, the Wired article below is broken into scheme (https), domain (www.wired.com), and path (2017/03/russian-hacker-spy-botnet/).
https://www.wired.com/2017/03/russian–hacker-spy-botnet/
Top Domains
Now the fun begins. I’m first interested in knowing which domains I read and save the most. In the snippet below, I group and count by the domain, and select the top 20%.
To visualize the result, I use the wordcloud2 package, developed by Dawei Lang, to create a word cloud.
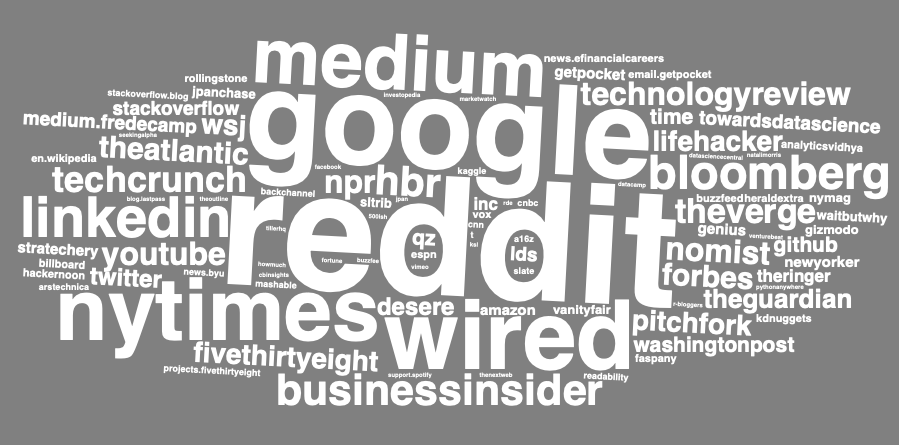
Looks about what I expected, a good mix of business and technology content sources, such as Wired, Medium, NY Times, and Business Insider. Although I’d like to understand how the content I save has changed over time, the Pocket export doesn’t include a timestamp of when the article was saved.
Topic Frequency
Next up, I take a tidytext approach to the list of link paths to analyze the topics I seem to be interested in. Using the unnest_tokens function, I create a data frame where each row is a word. With anti_join, I quickly remove common “stop” words, such as “the”, “of”, and “to”.
In order to create the word cloud to visualize topic prevalence, I first need to count word frequencies. Here I also removed several “noisy” words common in link paths, such as “click”, “news”, and “comments”.
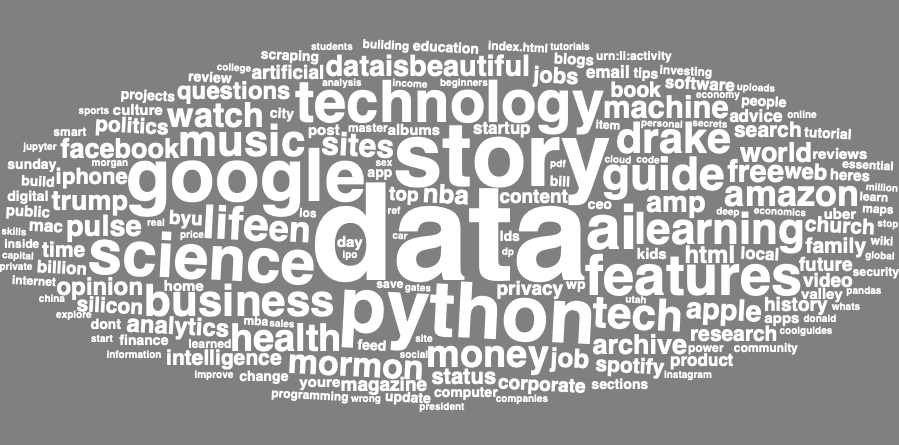
Data comes out on top! Here technology terms and topics like Python and AI are clearly visible, along with a sprinkling of other interests and hobbies like music (Drake, Spotify).
This was a fun and simple way to implement the principles I’ve learned reading Julia Silge and David Robinson’s book, Text Mining with R.

Web Photo Archiving with R
My wife and two of her sisters ran cross-country and track in high school. I recently learned that their team website, which hosts thousands of event photos from the past 10 years, is being shut down. Wanting to save my mother-in-law from the unimaginably tedious task of manually downloading each image, I wrote a script in R to automate the process.
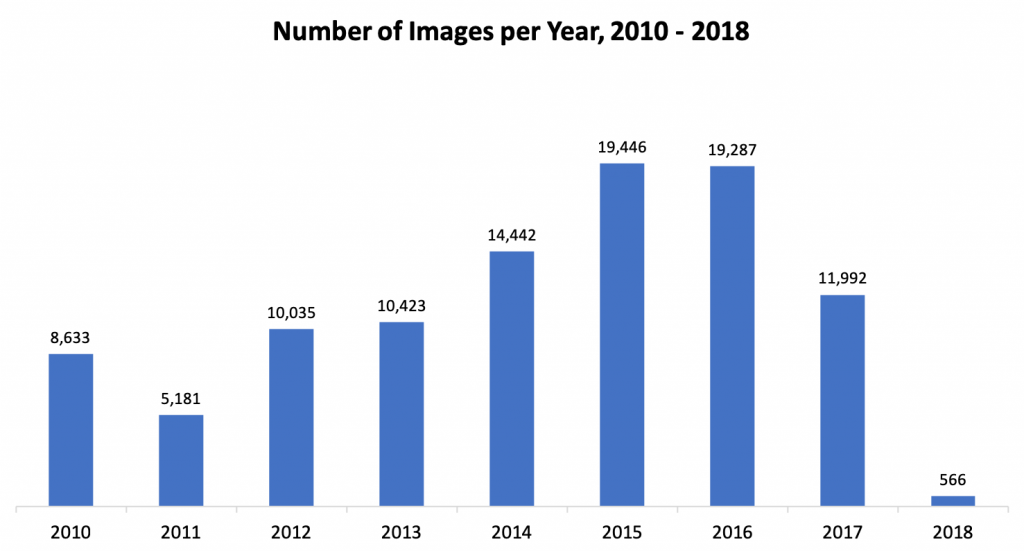
The website has a page for each season with links to event photo albums. For example, in the 2012 season, there are 81 photos albums and 10,000+ photos.
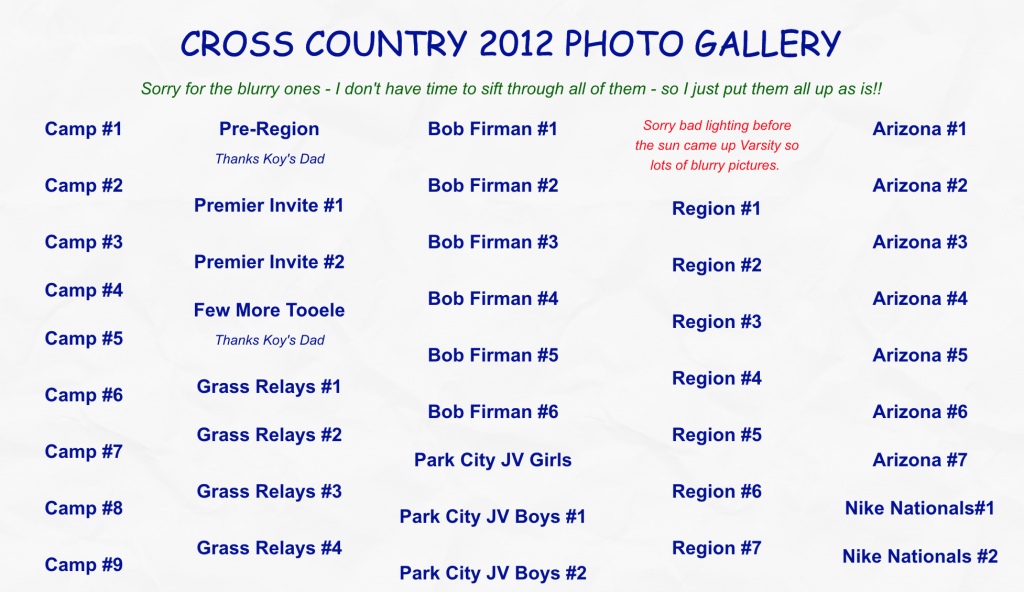
Each photo album contains somewhere between 80 and 150 photos. I needed to design the script to loop through and download each photo from each photo album.
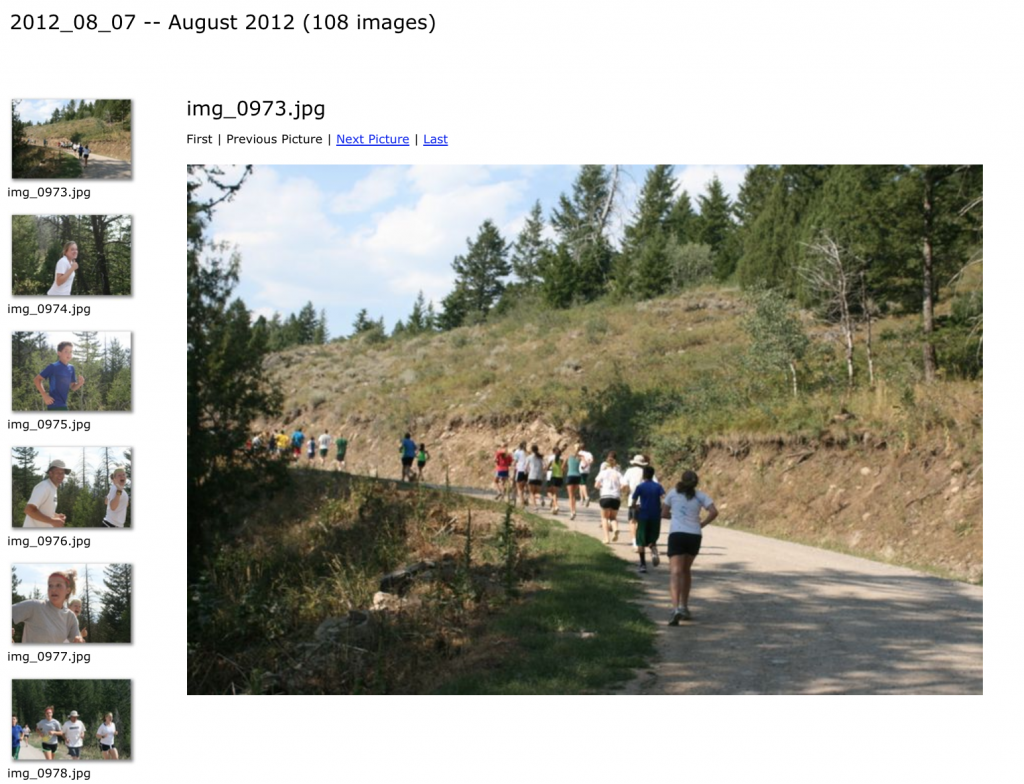
In other words, I needed a way to pass a URL like the one below into the “file
old.runtwolf.com/CC2012/Camp1/images/img_0973.jpg
Code Walkthrough
Let’s start by calling the two necessary packages:
After downloading the season overview page with the list of photo albums, I used html_nodes and
Finally, I looped through each photo album, replicating the folder structure locally, and downloading each of
After
The final step was the upload the images to the cloud for easy sharing and storage. Luckily, the
Assuming each image would have taken 20 seconds to download, label, and upload, the manual process would have taken ~500 hours, non-stop! Writing the scripts and monitoring the download and upload process took about 8 hours, for a net time saved of ~492 hours.
You can find the complete code here and archived photos here.
Thank you to Jen