Measuring Commute Times with IFTTT and R

Each morning I make the journey from the suburbs of Westchester County to downtown New York City. In the process, I ride the bus, train, and subway. This post is about quantifying my time spent commuting using IFTTT and R, which will hopefully add some weight to my complaints about the daily grind.

IFTTT is a free web service that “gets all your apps and devices talking to each other.” It allows you to create simple conditional statements to automate everyday tasks. Many of the applets are centered around making your smart home “smarter”, like automatically adjusting the thermostat when you leave home.

Rather than manually log when I leave home and work each day, I automate the tracking using IFTTT. To do so, I set up two “geo-fences“: one for home and one for work. Each time I enter or exit either of those areas, a new row is created in a Google Sheet. After letting this process run in the background for about two months, I have a good sample to work with.

Let’s start by calling the necessary libraries and importing the data. The googlesheets package by Jennifer Bryanmakes makes this easy.

After a quick bit of cleaning, I can calculate commute times by applying some simple logic. IFTTT is triggered every time I leave home or work, like when I grab lunch near the office or run to the grocery store. I only want to measure time when I leave home and then arrive at work or leave work and then arrive home. I check those conditions in a for-loop by comparing the location of event i and i+1.

Now for the fun part. Let’s make a density plot to visualize the distribution of times for both legs of the commute:

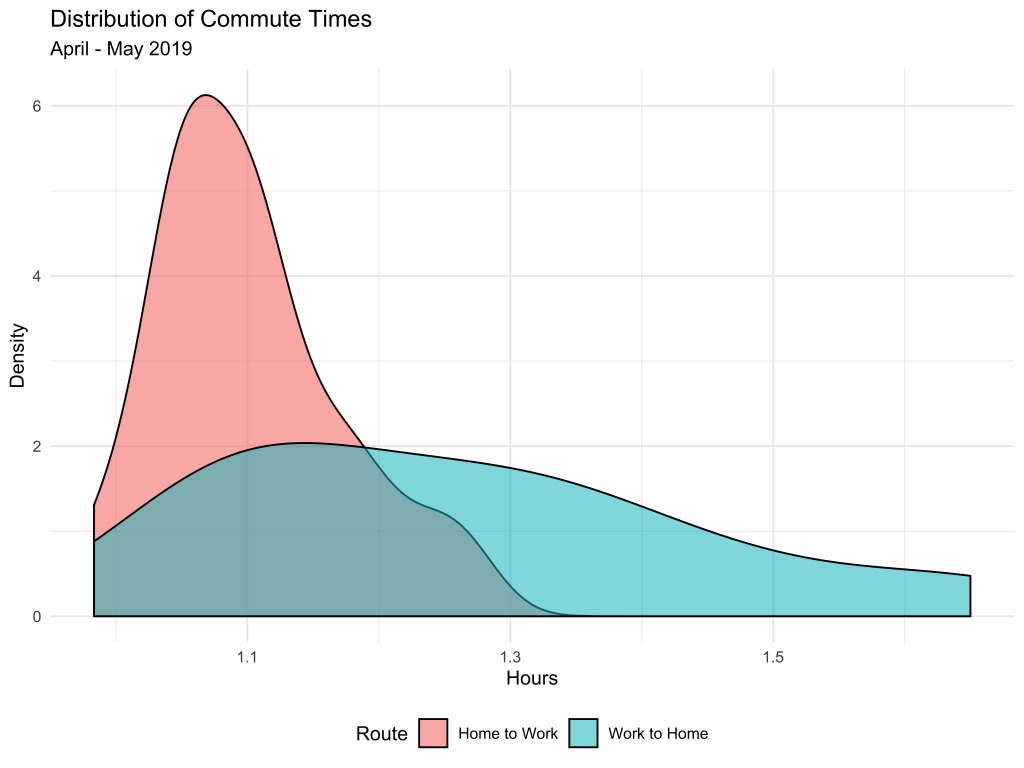
Because I catch the same bus every morning, travel times are more predictable, and more tightly centered around 1.1 hours. On the other hand, I rarely leave work at a consistent time. As a result, there’s more variation in how long it takes to get home, with some quick trips just over one hour and others close to two hours! In the future, I hope to leverage the Google Maps API to find the perfect times to leave work to minimize my commute home.

Thanks for reading! Check out the full code here.

Scraping Stack Overflow Salaries with Python

I recently discovered a salary calculator on Stack Overflow. The tool takes inputs like role, location, and education and outputs salary predictions at the 25th, 50th, and 75th percentile.

Salary Calculator Interface

Based on the results of the annual developer survey, the calculator seems like an interesting way to study the marginal impact of expereince and education on earnings. As a recent undergraduate, I might be interested in understanding the impact of graduate degrees on income potential.

Calculator Output

To extract Data Scientist salary data (or extrapolated data) from the tool, I wrote a Python script using Selenium to loop through 350+ different combinations of location, education and expereince.

Results

There are many reasons to exercise skepticism when analyzing this data, like self-selection bias inherent to surveys. It’s obviously very unlikely that a data scientist responded from each location, education, and experience combination. Even if they did, salaries are likely to vary widely. To strengthen any insight derived from this analysis, I’d also collect data from sources like Glassdoor or Indeed, especially before making any significant education or relocation decisions!

With that long disclaimer in mind, below I visualize the scraped data with an interactive Tableau dashboard. You can filter by years of expereince and location to understand salary levels by education level:

One disappointment I had was realizing that much of the data returned from the calculator was the same across locations. The same salaries were also returned across expereince and education levels for graduate and postgraduate degrees. Despite the data shortcomings, this was an interesting exercise in automating data extract from web forums using Selenium. Thanks for reading!

Appendix

Python Script: Link
R Script: Link
Dataset: Link
Tableau Dashboard: Link

Web Photo Archiving with R

My wife and two of her sisters ran cross-country and track in high school. I recently learned that their team website, which hosts thousands of event photos from the past 10 years, is being shut down. Wanting to save my mother-in-law from the unimaginably tedious task of manually downloading each image, I wrote a script in R to automate the process. 

The website has a page for each season with links to event photo albums. For example, in the 2012 season, there are 81 photos albums and 10,000+ photos. 

Each photo album contains somewhere between 80 and 150 photos. I needed to design the script to loop through and download each photo from each photo album.

In other words, I needed a way to pass a URL like the one below into the “file.download” function to save an image to my computer.

old.runtwolf.com/CC2012/Camp1/images/img_0973.jpg

Code Walkthrough

Let’s start by calling the two necessary packages: rvest and dplyr. These both form part of tidyverse, a collection of packages created by Hadley Wickham that share a common design philosophy. 

After downloading the season overview page with the list of photo albums, I used html_nodes and grepexpr to extract and clean the list of album names to form a list of album URLs. 

Finally, I looped through each photo album, replicating the folder structure locally, and downloading each of the .JPEG files.

After all was said and done, I had downloaded 100,005 images from 759 photo albums across 9 XC seasons.

The final step was the upload the images to the cloud for easy sharing and storage. Luckily, the googledrive package allowed me to upload the images via a script rather than manual bulk upload.

Assuming each image would have taken 20 seconds to download, label, and upload, the manual process would have taken ~500 hours, non-stop! Writing the scripts and monitoring the download and upload process took about 8 hours, for a net time saved of ~492 hours.  

You can find the complete code here and archived photos here. 

Thank you to Jen Fitzgarrald for capturing so many wonderful images over the past decade. 

css.php