
From the earliest days of our marriage, my wife and I talked about baby names. Your name is a core part of your identity, so choosing the right name for your child feels like a weighty affair. Now, with a baby on the way, the topic surfaces in conversation more than ever.
Like always, I turned to data to assist with the decision process. Using a dataset provided by the Social Security Administration, I created functions with R to visualize and compare the popularity of names over time.
There are two functions: the comparison of two names over time and the comparison of a name against a birth year over time. Below is sample implementation:
I first compared the popularity of the spelling of my name, Erik, to the more common spelling, Eric.
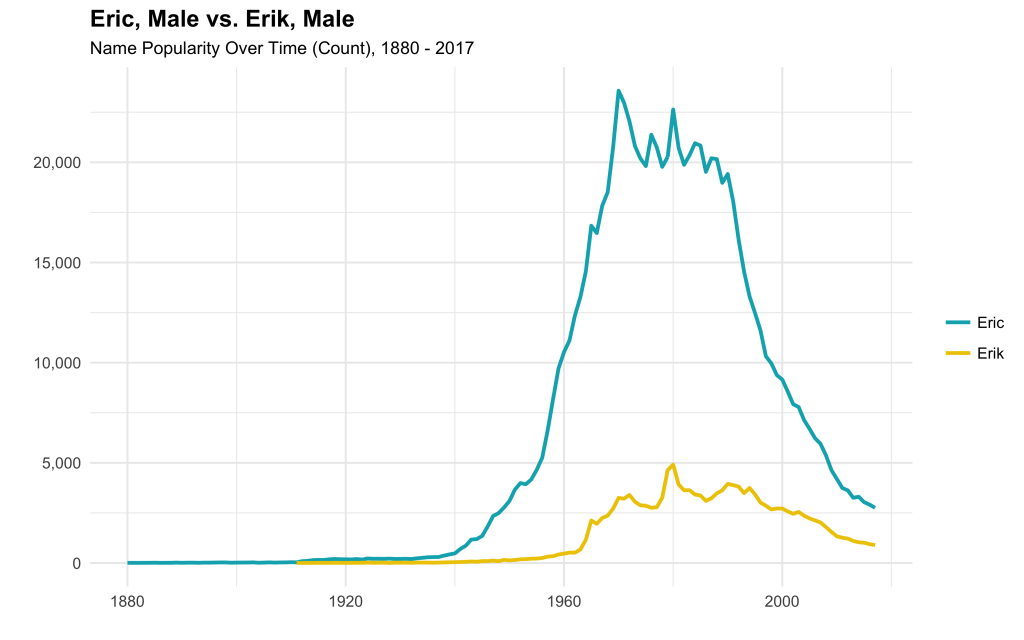
Erik has never been as popular as Eric, although both are currently down from their 1970 – 1990 peak.
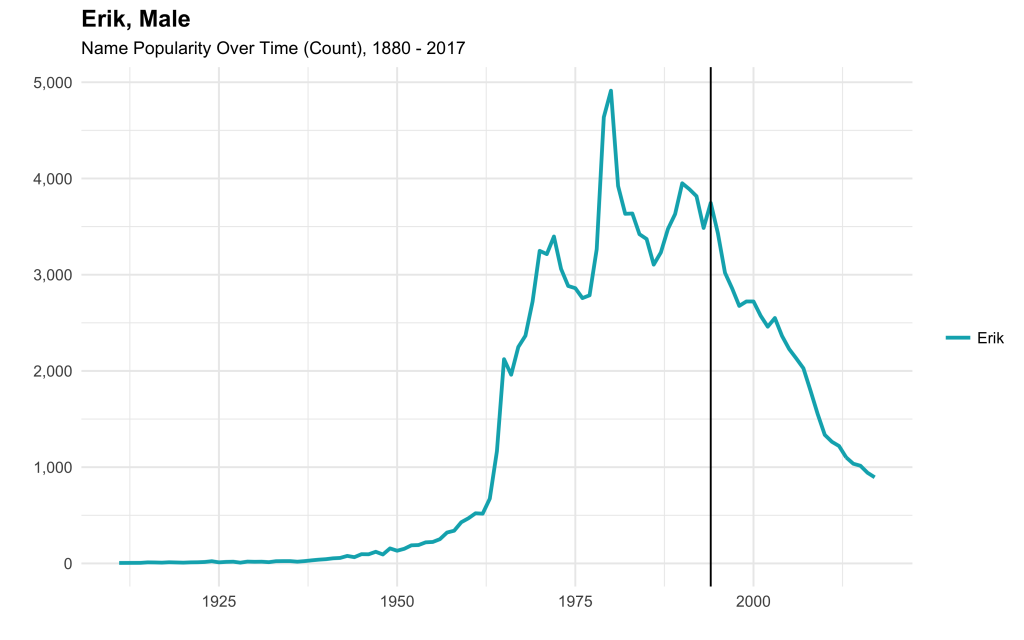
Next, I compared the popularity of my name in the context of my birth year. It looks like my parents named me around the start of the decline in popularity.
How does my name compare with my wife’s?
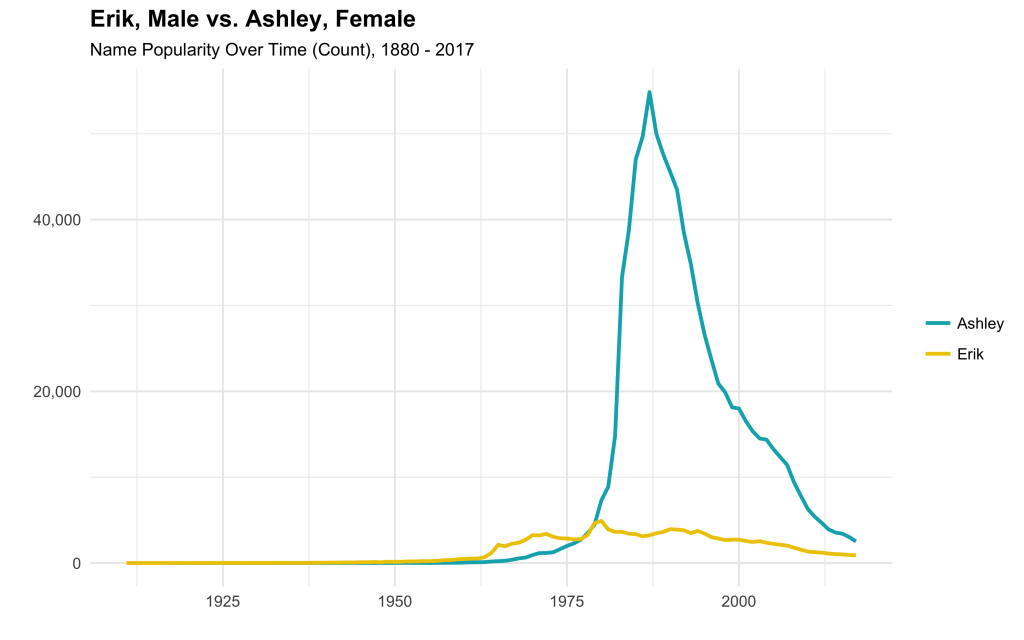
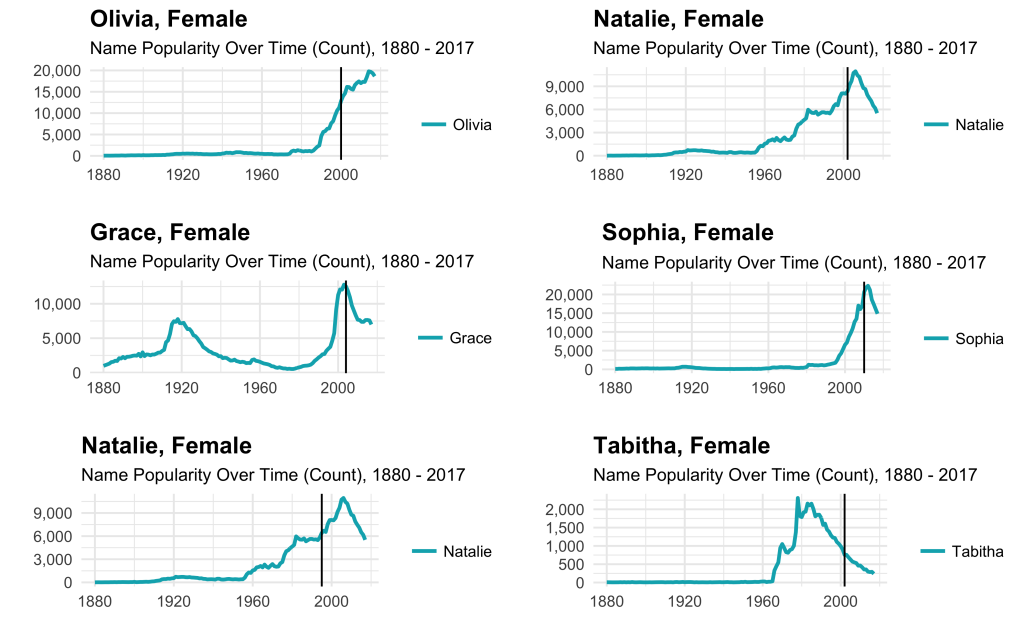
What can I say? She’s always been more popular. What about the names of my six sisters? (including sisters-in-law).
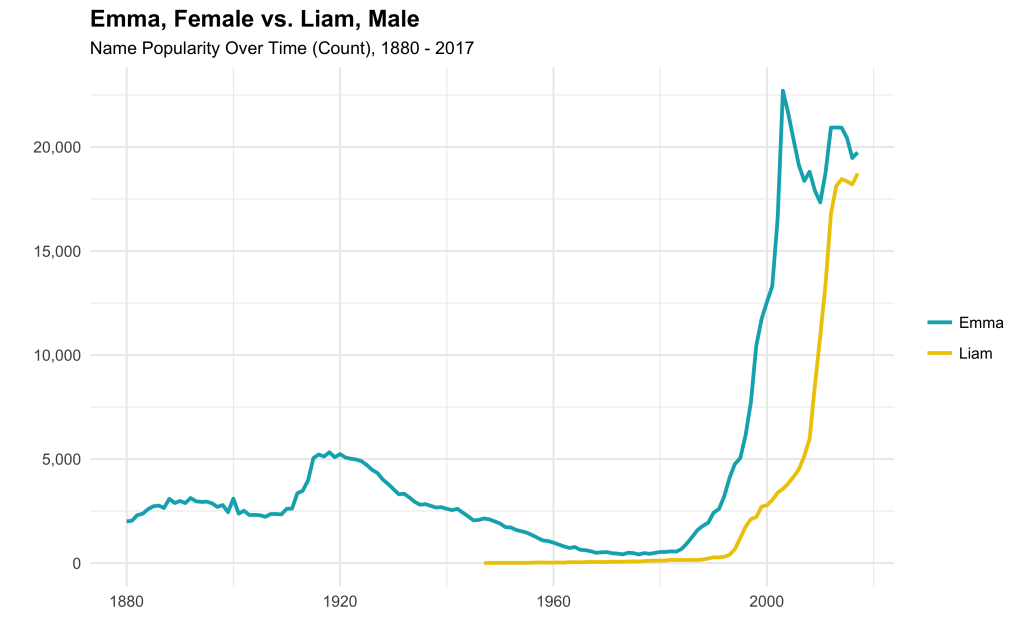
Finally, let’s take a look at the most popular boy and girl names of 2017, Liam and Emma.
This was a fun and simple way to interact with publicly available baby name data. You can find the dataset here and the code to create the functions here.
Tabitha is such a great name! I love that it peaked in the 60’s, that’s when the television show Bewitched was popular! Tabitha was the baby/little girl in the show! It also belonged to a super great lady in the New Testament and Tabitha Twitchet is a mom cat in a Beatrix Potter story! Love your amazing analytics!
Very interesting analysis. We definitely see many couples are worried about the right name for their baby. Thank you for the post.
This is one of my favorite posts! I’ve always been so interested in Baby Names. Love this.