Scraping Stack Overflow Salaries with Python

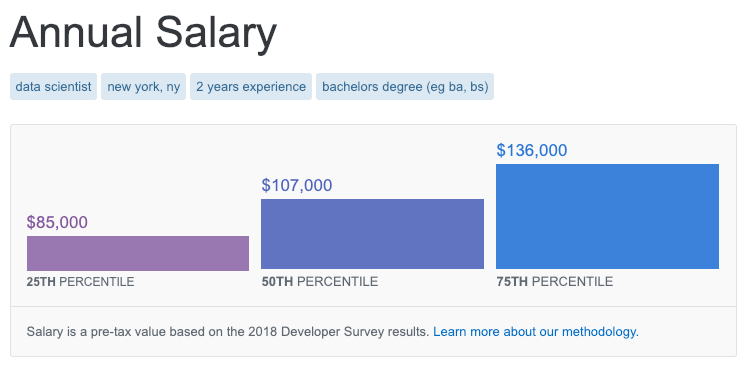
I recently discovered a salary calculator on Stack Overflow. The tool takes inputs like role, location, and education and outputs salary predictions at the 25th, 50th, and 75th percentile.

Salary Calculator Interface

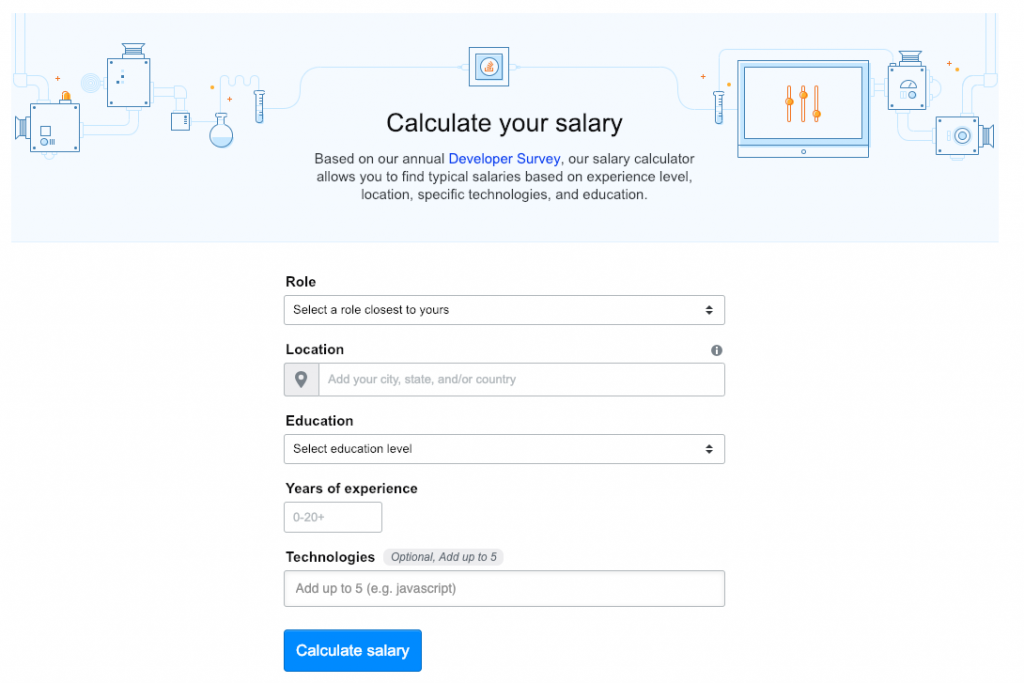
Based on the results of the annual developer survey, the calculator seems like an interesting way to study the marginal impact of expereince and education on earnings. As a recent undergraduate, I might be interested in understanding the impact of graduate degrees on income potential.

Calculator Output

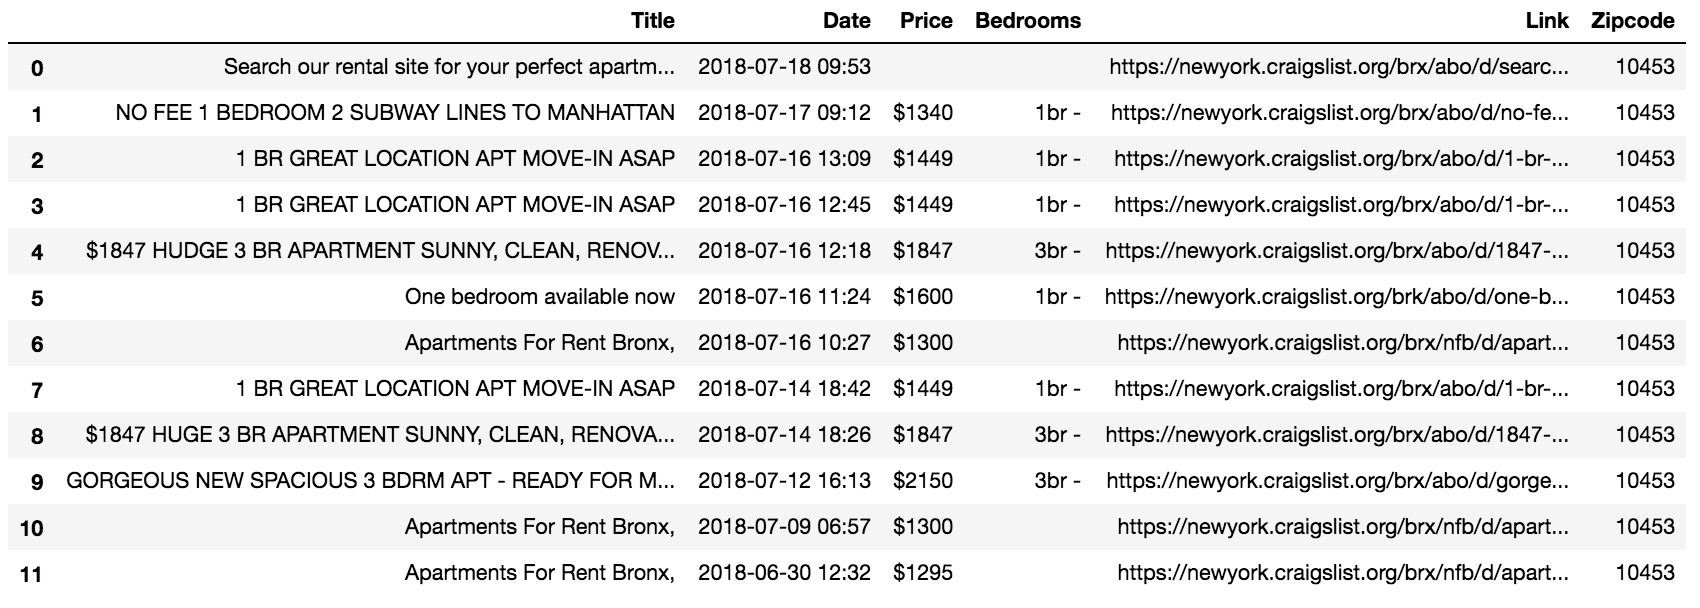
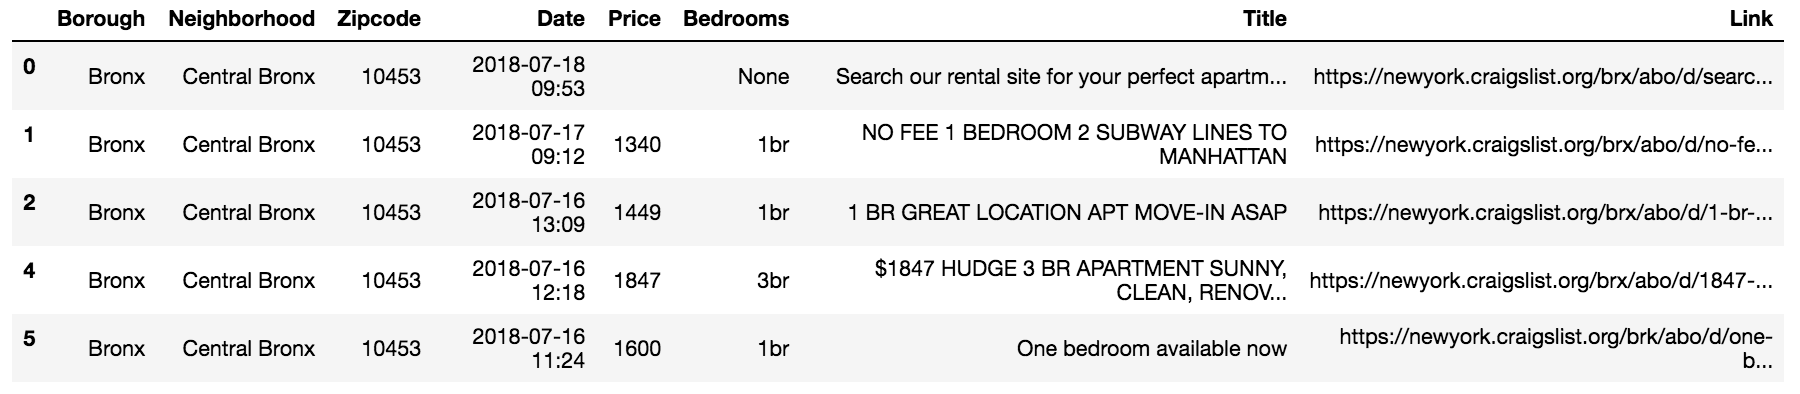
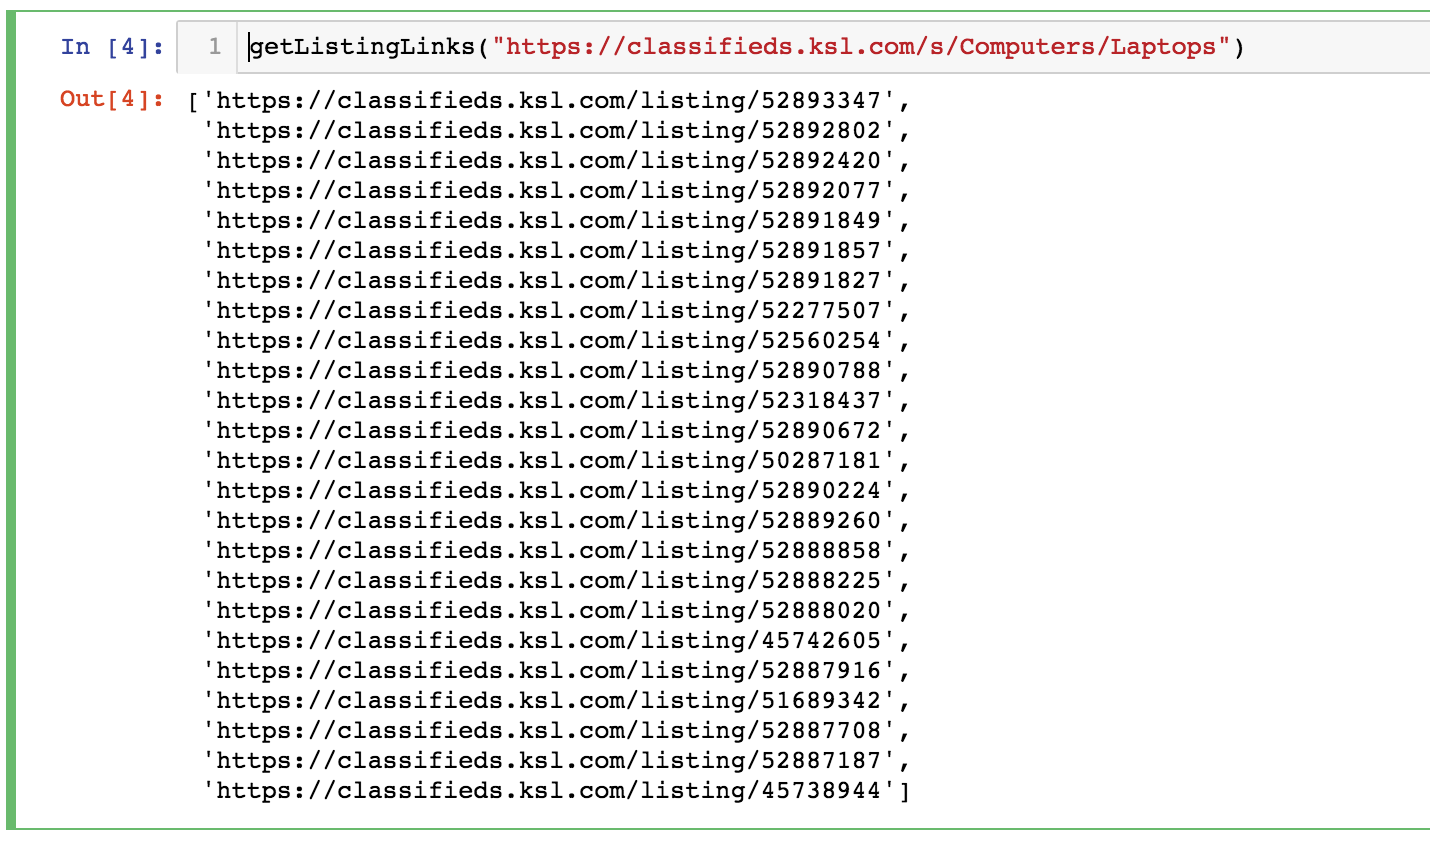
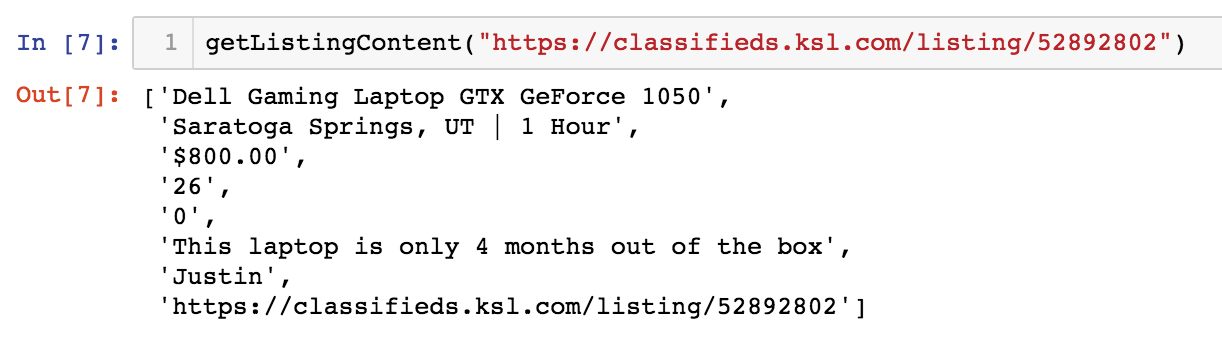
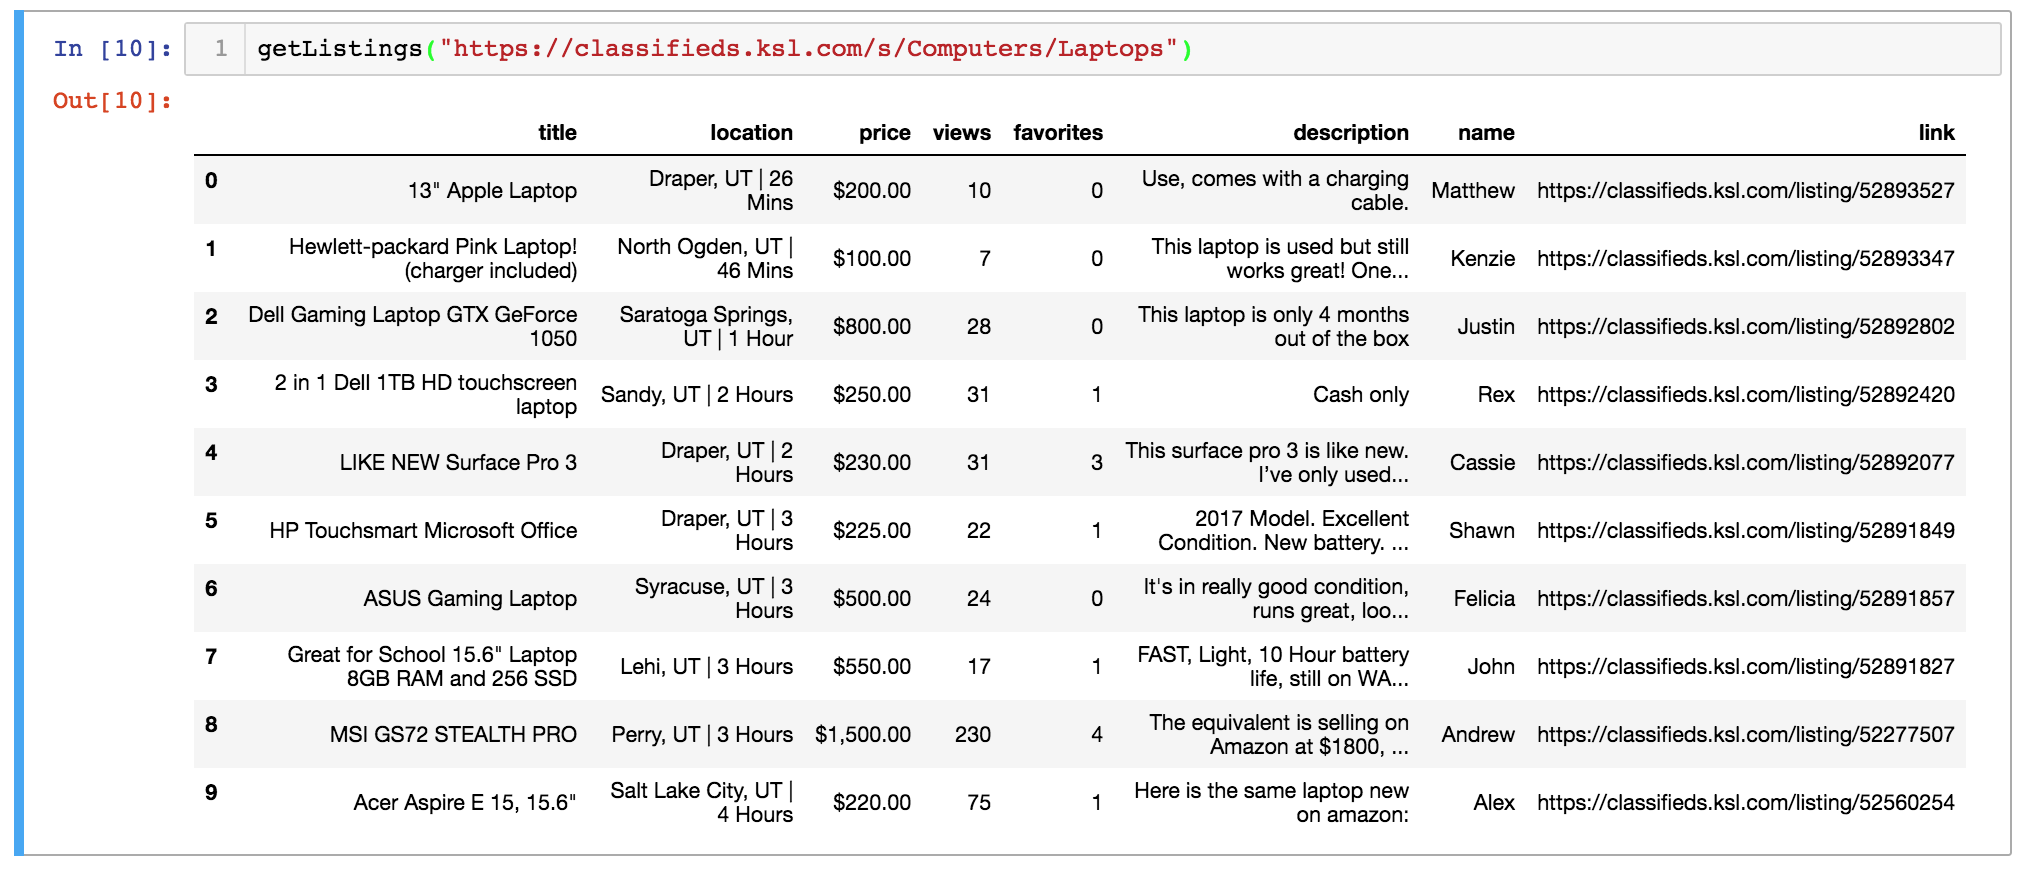
To extract Data Scientist salary data (or extrapolated data) from the tool, I wrote a Python script using Selenium to loop through 350+ different combinations of location, education and expereince.

Results

There are many reasons to exercise skepticism when analyzing this data, like self-selection bias inherent to surveys. It’s obviously very unlikely that a data scientist responded from each location, education, and experience combination. Even if they did, salaries are likely to vary widely. To strengthen any insight derived from this analysis, I’d also collect data from sources like Glassdoor or Indeed, especially before making any significant education or relocation decisions!

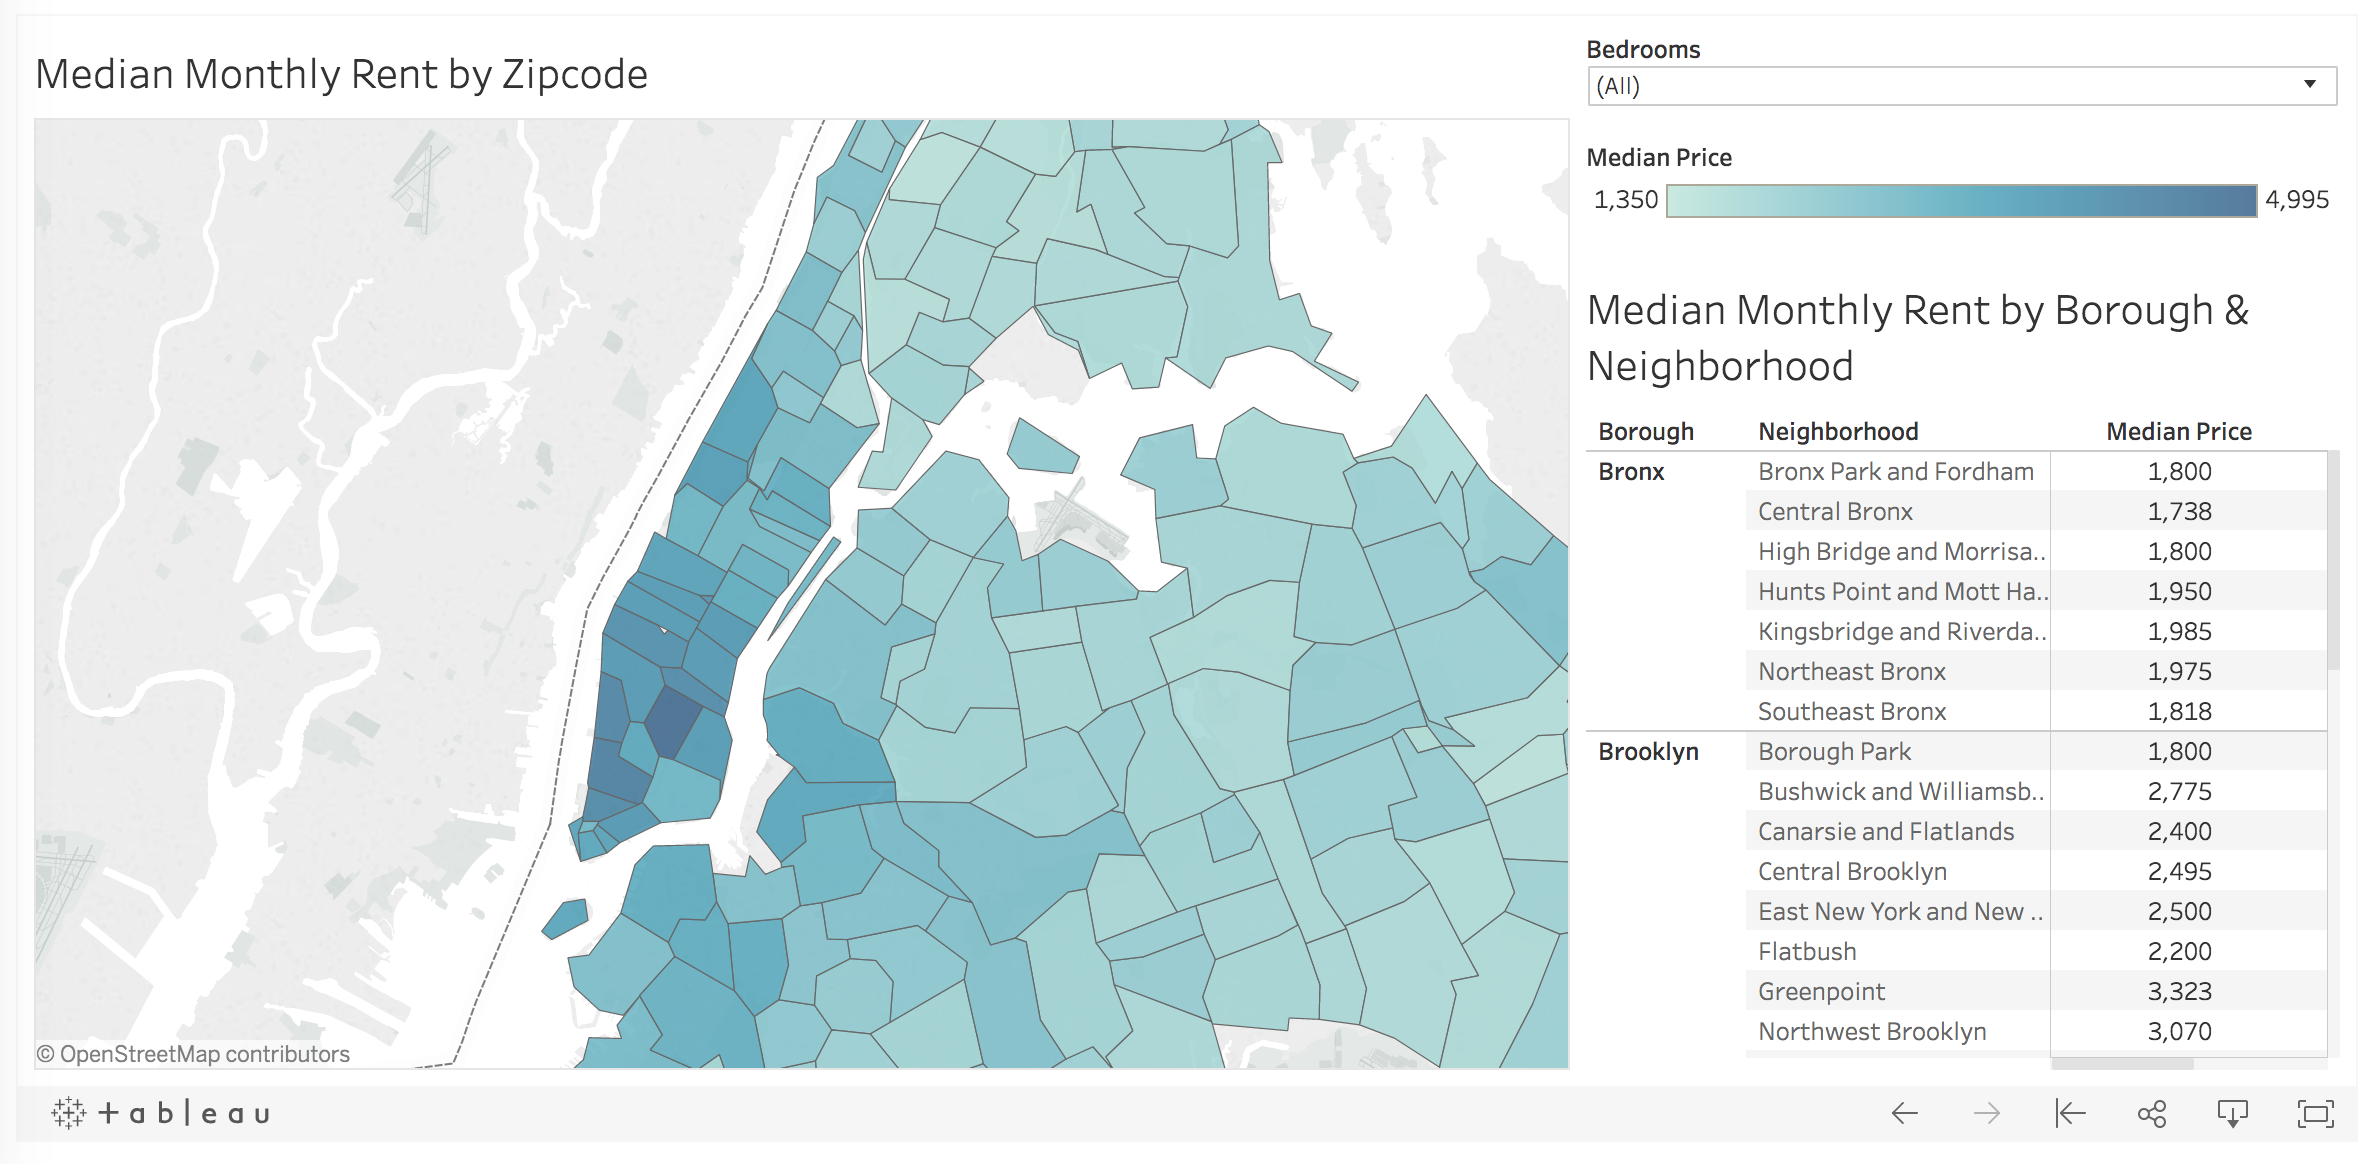
With that long disclaimer in mind, below I visualize the scraped data with an interactive Tableau dashboard. You can filter by years of expereince and location to understand salary levels by education level:

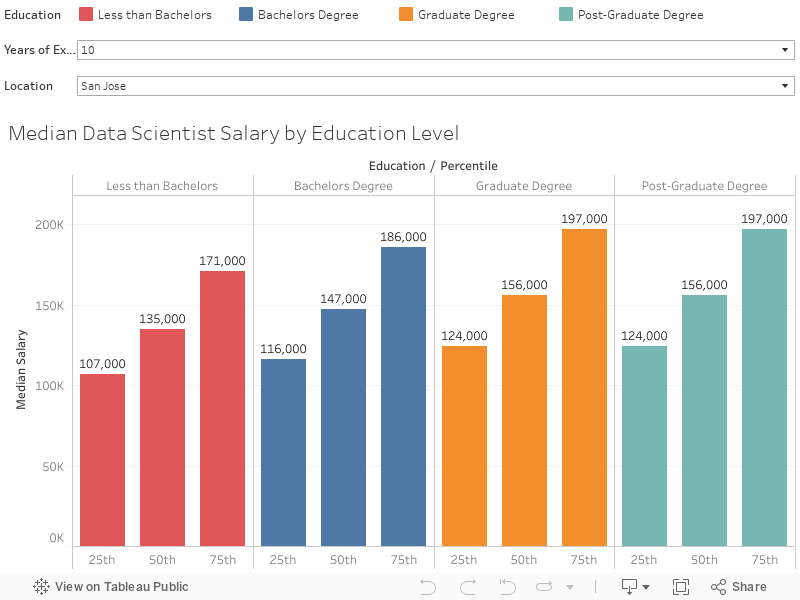
One disappointment I had was realizing that much of the data returned from the calculator was the same across locations. The same salaries were also returned across expereince and education levels for graduate and postgraduate degrees. Despite the data shortcomings, this was an interesting exercise in automating data extract from web forums using Selenium. Thanks for reading!

Appendix

Python Script: Link
R Script: Link
Dataset: Link
Tableau Dashboard: Link

Speaker Gender Ratios in LDS General Conference

This weekend was LDS General Conference, a semiannual meeting where leaders speak to church members worldwide. After following the Twitter #GeneralConference hashtag, I became interested in the frequency of women speakers during past conferences. Using Python, I scrapped 40+ years of speaker data from LDS.org to understand the speaker gender ratio trend over time. Below is the code used and a graphic illustrating my findings.

Over the past 47 years, on average, women have comprised about 10% of the speakers per conference.

You can find the GitHub gist here and the full dataset here.

Using the Google Maps API to Visualize Chase’s Presence in Utah

I’ve been a happy Chase customer since 2010. I’ve appreciated the investment in their mobile platform and was excited about the recent You Invest announcement, allowing customers to trade 100 stocks and ETFs a year for free. With 5,100+ branches and 16,000 ATMs+ nationwide, Chase has a strong national footprint.

In this post, I use Python to recreate the map below for my home state of Utah, scrapping branch and ATM information from Chase.com and obtaining geographic coordinates using the Google Maps geocoding API.

chase-footprint
Chase branches in the U.S. in 2010. Source: Wikipedia

Before going further, I’d invite you to read Chase.com’s Terms of Use as well as Roberto Rocha’s article about the ethics of web scrapping. To avoid excessive server demands (although an unlikely issue for Chase), we’ll explicitly space out requests, made easy with Python’s time sleep method.

Scrapping Branch & ATM Information with Selenium

As usual, we’ll begin by calling the necessary libraries.

Next, we need to pass the driver a URL. Here I’ve used the Utah URL. This could easily be adapted to other states by changing the last two letters of the link.

Also note the executable path, which is pointed to the directory where my ChromeDriver is located. You can download the driver here.

When this code finishes running, the “locations” list contains location names, such as the following Utah cities:

We then convert these locations into Chase.com URLs.

The links now look like this:

The function below represents the process of scrapping the data for each location.

We’ll apply the function to each location URL to extract the corresponding branch and ATM information.

Finally, we’ll clean the information we’ve scrapped and organize it into tidy columns.

Here a sample of what the final dataset looks like:

LocationAddressType
Bountiful510 S 200 W Bountiful, UT 84010Branch
Farmington Station Park100 N Station Pkwy Farmington, UT 84025Branch
Brigham Young University800 E Campus Dr Provo, UT 84602ATM
Fashion Place6255 S State St Murray, UT 84107Branch

Geocoding Branch Address via Google Maps API

Per Google’s Get Started article, geocoding is the process of converting addresses into geographic coordinates, like latitude and longitude. Once we have a longitude and latitude combination, we can plot the branch and ATM locations on a map using Tableau or R.

Here is the Python code used to accomplish the geocoding:

Please note that you’d need to insert your own Google Cloud API key to make the code run. Finally, let’s visualize some of the data points with R!

Here’s the code to create this visualization:

You can view the data here and the complete code here. Thanks for reading!

The Hunt for Housing in NYC: A Data-Driven Approach

This summer my wife and I relocated to New York City in preparation for the start of my new job. Housing in Manhattan and the surrounding boroughs is notoriously expensive, so I decided to pursue a data-driven approach to our apartment search. I wrote a Python script to scrape 9,000+ apartment listings on Craigslist for zip codes in the five boroughs: Manhattan, Bronx, Brooklyn, Queens, and Staten Island. I then visualized the median rent by zip code in Tablaeu. Check out the dashboard here!

Gathering the Data

Before digging into some housing insights, let’s walk through the process used to obtain the data. First, I obtained data about the organization of New York City’s boroughs, neighborhoods, and zip codes from a New York State Department of Health website. I then leveraged the structure of Craigslists’s URLs to construct a vector of links to search for apartments in each of the zip codes. Here’s what the URL to search for apartments with the zip code 10453 looks like:

https://newyork.craigslist.org/search/aap?postal=10453

Let’s see what that looks like in code.

The ‘nyc-zip-codes.csv’ file referenced above can be found here. Next, I wrote a function to extract the pertinent information from each listing from each of these links. I extracted the listing title, posting date, monthly rent, and the number of bedrooms, when available.

This is what the function returns when fed the sample link for zip code 10453.

At this point, we just need a way to loop through each zip code and compile the data the function returns.

After cleaning the data and removing duplicates, we have about 9,400 listings to work with.

Analyzing the Data

Let’s start with the big picture and then zoom in. Below we have the median rental price of listings by borough. Manhattan is by far the most expensive place to live, followed in distant second by Brooklyn. Queens, Staten Island, and the Bronx are actually somewhat comparable, with median rent in Queens only $250 higher than median rent in the Bronx.

How does rent vary in the five boroughs by the number of bedrooms the unit has? Filtering the data to include only units with 1 to 4 bedrooms, Manhattan is still the most expensive for each number of bedrooms.


Note that the bracketed, italicized numbers above show the number of listings for each borough and bedroom combination.

My wife and I had hoped to find a 2-bedroom apartment in a safe neighborhood with a 30-minute commute to Midtown for $2,000 or less. But, as you can see in the image below depicting median 2-bedroom rent by zip code in Queens, that may be a tough find!

Now, what else would I have liked to add to this analysis? Since one major consideration in the hunt for housing is commute time, how about a distance-adjusted median rental price metric for each zip code? This is something I’ll tackle in a future post.

Conclusion

Ultimately, my wife and I found housing in Scarsdale through a family friend and didn’t end up living in any of the five boroughs! Luckily, by feeding the script a different set of zip codes and modifying the Craigslist URL structure, I’ll be able to replicate this data-driven process in future apartment searches.

Find the complete code here, hosted as a Gist on GitHub.

Check out my other data projects here.

Complete Python Selenium Web Scraping Example

Introduction

I recently listed a couple of items for sale on a Craigslist-like site called KSL Classifieds. It’s a rich marketplace to buy and sell almost anything. This is what a listing looks like:

ad-example

I instinctively started thinking about how to collect information about listings in this marketplace in a systematic way.  Why might this kind of autotomized data collection be valuable? Here are two possible use cases:

  • Listing optimization. We could analyze how features of a listing (number of pictures, description length, listing category/subcategory, etc.) are related to outcomes such as the number of views, if the item is “favorited” by users, or whether or not the item was sold. This kind of data-driven listing optimization could drive sales for sellers.
  • Automated Item Search. There’s value for buyers as well. Suppose I’m looking for something specific, like a wakeboard for family boating outings. I could easily automate a script to scrape all wakeboard listings daily and send me the information via email, simplifying the search process.

Walkthrough

Let’s jump into the walkthrough. At a high level, we know we want our web scraping script to take a KSL Classified URL as input and output a CSV containing neatly-arranged data from each listing. Here’s what the starting page might look like:

search-example

Given this page, we need to find all the links to listings, navigate to each listing page, and then extract the desired information. Each listing contains the following features:

  • Title
  • Location (City, State)
  • Time Posted
  • Price
  • Number of Views
  • Number of Favorites
  • Description
  • Seller Information

With that as background, let’s get into the code. We’ll start by calling the libraries.

Next, we’ll write a function to extract all the listing links from a search result page like the one above.

Note that I’m using “ChromeDriver”. It can be downloaded here. Below is what the output of our function looks like. We now have a vector of links to specific listings.

get-listing-links-exampleNow we need to iterate through each of these listings and extract the desired information. Below is a function called getListingContent() which takes a listing link and return the title, location, time since listing posting, price, views, favorites, description, seller, and the listing URL.

Again, here’s what the output of this function would look like:

get-listing-content-example

Pretty slick eh? Now let’s combine these two functions!

Here we’re only going to loop through the first ten of the listing links gathered by getListingLinks(). After the loop, we’ll neatly arrange the extracted data into a Pandas DataFrame.

get-listings-example

To finish things off, we’ll clean the data. This includes reformatting the “price” variable and changing “views” and “favorites” from strings to numbers.

Finally, let’s tie it all together with the main() function:

Nice work! We can now pass a link to main() and it will generate a tidy CSV file with information about the listing from that page. You can find the complete scraper code here. Below are some resources that proved helpful to me in creating this example:

css.php