How to send yourself a notification when your code is done running

I have a couple of Python scripts scheduled to run daily and hourly using pythonanywhere. These scripts help automate tasks for me, like tracking cryptocurrency prices or sending texts to friends on their birthday.

Sometimes, the jobs fail and the code doesn’t run. Since I’d like to know when that happens, I add a few lines of code to send myself a text when something goes wrong.

To get started, create a Twilio account. You’ll need three things from your Twilio account to make the code work: an account sid, auth token, and active Twilio phone number.

Locate your account sid and auth token from the Twilio dashboard home page.

Copy the code snippet below, switching out the account sid, auth token, and sender and recipient phone numbers. Note that the phone numbers should be formatted like this: +18299321023. This is the machine-readable version of (829) 932-1023.

In practice, you can set up your automated scripts with a structure like this:

Pretty easy, right? Twilio’s API makes it simple to get SMS alerts in just a few lines of code.

5 simple ways to improve your digital security

When it comes to online security and privacy, it doesn’t hurt to be a bit paranoid.

Even if you follow best practices like using two-factor authentication or password management software, it’s possible that loved ones like parents, grandparents, siblings, or close friends are not doing the same. For example, chances are good you know someone that uses a single password for every account!

Hoping to provide some straight-forward, actionable steps to help my family members get serious about their digital footprint, I put together a deck with five simple tips for improving digital security. Even though better security usually means less convenience, helping others get serious about managing their digital life is worth the effort.

Here are the slides. You can also download a PDF copy here.

How to build a simple mobile app in 30 minutes or less

A few weeks ago I took a GRE practice test to gauge how much preparation I’d need before officially taking the exam. The scores revealed a skill gap, especially in the Verbal Reasoning section. To do well, it turns out you need a pretty robust and sophisticated vocabulary. 💡

With that insight, it was apparent I needed a way to log unfamiliar words to expand my vocabulary. I hoped to automate the process of inputting word definitions. Combining the power of Google Sheets, Glide, and Rapid API, I built a simple mobile app to help level up my vocabulary-building efforts. Take it for a spin here!

App Components

Google Sheets (Database): Spreadsheets are the most successful programming model of all time, and for small projects, a Google Sheet is a great database.

Google Sheets: The database

Glide (App UI): Glide allows you to build beautiful apps without any code using drag-and-drop building blocks. After connecting to the Google Sheet “back end”, it was easy to assemble a polished progressive web app that looks and feels like a native iOS app from the App Store.


Glide: The app user interface

RapidAPI (The Dictionary API): To automate the process of sourcing word definitions and synonyms, I turned to the WordsAPI, available in the RapidAPI marketplace. The free tier includes 2,500 API calls a day.

RapidAPI / WordsAPI: the dictionary API

The cool part is that you can make external API calls in a Google Sheet via Apps Script (a scripting platform developed by Google for light-weight application development in the G Suite platform). This required a dabble in JavaScript, which was new to me as a heavy R/Python user.

The code is broken up into two functions:

  • wordsAPImakes a GET call to the WordsAPI and saves the response
  • getWordSynonym extracts the word definition from the JSON body

The best part is that once the code is saved in the App Scripts file, you can call the custom function directly in Google Sheets, just like a regular function:

=ARRAYFORMULA(getWordSynonym(A2:A))

With Google Sheets and Glide, together with WordsAPI, I was able to make the simple tool I needed to save, learn, and review new words in order to prepare for the GRE exam. It’s exciting to see new no-code/low-code platforms (i.e. Glide) being developed that make anyone a builder.

My GRE Vocab App: grevocab.glideapp.io
Underlying Google Sheet (View Only): Link
App Scripts JS Code: Link

Measuring Commute Times with IFTTT and R

Each morning I make the journey from the suburbs of Westchester County to downtown New York City. In the process, I ride the bus, train, and subway. This post is about quantifying my time spent commuting using IFTTT and R, which will hopefully add some weight to my complaints about the daily grind.

IFTTT is a free web service that “gets all your apps and devices talking to each other.” It allows you to create simple conditional statements to automate everyday tasks. Many of the applets are centered around making your smart home “smarter”, like automatically adjusting the thermostat when you leave home.

Rather than manually log when I leave home and work each day, I automate the tracking using IFTTT. To do so, I set up two “geo-fences“: one for home and one for work. Each time I enter or exit either of those areas, a new row is created in a Google Sheet. After letting this process run in the background for about two months, I have a good sample to work with.

Let’s start by calling the necessary libraries and importing the data. The googlesheets package by Jennifer Bryanmakes makes this easy.

After a quick bit of cleaning, I can calculate commute times by applying some simple logic. IFTTT is triggered every time I leave home or work, like when I grab lunch near the office or run to the grocery store. I only want to measure time when I leave home and then arrive at work or leave work and then arrive home. I check those conditions in a for-loop by comparing the location of event i and i+1.

Now for the fun part. Let’s make a density plot to visualize the distribution of times for both legs of the commute:

Because I catch the same bus every morning, travel times are more predictable, and more tightly centered around 1.1 hours. On the other hand, I rarely leave work at a consistent time. As a result, there’s more variation in how long it takes to get home, with some quick trips just over one hour and others close to two hours! In the future, I hope to leverage the Google Maps API to find the perfect times to leave work to minimize my commute home.

Thanks for reading! Check out the full code here.

Choosing the Right Hospital: Exploratory Analysis in R

With our baby’s due date quickly approaching, my wife and I needed to find a hospital for delivery. Hoping to contribute something meaningful to the decision, I found data published by the state of New York on labor and delivery metrics. By visualizing measures like percentage of cesarean deliveries, I narrowed the list of hospitals within our county.

Despite my belief in “data-driven” decision-making, I understand that in the real world, most decisions are part art, part science, requiring a mix of qualitative and quantitative factors. That being said, in this post, I describe how I leveraged publicly-available data to help choose a hospital for my wife’s delivery.

Data Overview

The dataset spans a ten-year period, from 2008 to 2016, with data for 146 hospitals in 52 counties. Four general categories of metrics are present:

  • Anesthesia & Analgesia       
  • Characteristics of Labor & Delivery
  • Infant Feeding Method
  • Route & Method

Since I lack the subject matter expertise to understand something like the difference between paracervical and pudendal anesthesia, some of the value of the dataset is lost. Despite the knowledge gaps, I’ll next visualize some of the more straightforward measures of labor and delivery to uncover insights about hospital quality.

Visualization & Analysis

First item of discussion: Where are most babies born in Westchester County?

In 2016, the most babies were born at the White Plains Hospital Center.

Volume may matter. Hospitals who deliver more babies may be exposed a wider spectrum of complications and be prepared to deliver treatment accordingly. On the other hand, large-scale operations likely produce strict standardized policies and procedures, with little room for customized delivery plans.

How has the volume of births change over the 10-year period? 

Every hospital seems to be trending flat or down, which may be a reflection of more general demographic trends.

Next up, let’s examine which hospitals work with midwives. This was an important consideration in our decision process.

Pretty clear. Phelps Memorial and Hudson Valley Hospitals are midwife friendly, with 40%+ of births attended by a midwife.

Is there any relationship between births attended by midwifes and other labor outcomes?

It appears that mid-wife friendly hospitals enjoy a lower c-section rate, although I’m not implying that one causes the other. It would take more than a scatter plot to tease out the true nature of that relationship.

Let’s take a closer look at c-section rates by hospital over time.

There was a long stretch of time at Lawrence hospital where more cesarean sections were performed than vaginal births. Easy red flag!

This simple analysis was informative and eye-opening. With the list significantly narrowed, it’s time to tour the facilities, read reviews, and speak with medical providers to make the final decision.

Here’s a link to the code and data. Thanks for reading!

Web Photo Archiving with R

My wife and two of her sisters ran cross-country and track in high school. I recently learned that their team website, which hosts thousands of event photos from the past 10 years, is being shut down. Wanting to save my mother-in-law from the unimaginably tedious task of manually downloading each image, I wrote a script in R to automate the process. 

The website has a page for each season with links to event photo albums. For example, in the 2012 season, there are 81 photos albums and 10,000+ photos. 

Each photo album contains somewhere between 80 and 150 photos. I needed to design the script to loop through and download each photo from each photo album.

In other words, I needed a way to pass a URL like the one below into the “file.download” function to save an image to my computer.

old.runtwolf.com/CC2012/Camp1/images/img_0973.jpg

Code Walkthrough

Let’s start by calling the two necessary packages: rvest and dplyr. These both form part of tidyverse, a collection of packages created by Hadley Wickham that share a common design philosophy. 

After downloading the season overview page with the list of photo albums, I used html_nodes and grepexpr to extract and clean the list of album names to form a list of album URLs. 

Finally, I looped through each photo album, replicating the folder structure locally, and downloading each of the .JPEG files.

After all was said and done, I had downloaded 100,005 images from 759 photo albums across 9 XC seasons.

The final step was the upload the images to the cloud for easy sharing and storage. Luckily, the googledrive package allowed me to upload the images via a script rather than manual bulk upload.

Assuming each image would have taken 20 seconds to download, label, and upload, the manual process would have taken ~500 hours, non-stop! Writing the scripts and monitoring the download and upload process took about 8 hours, for a net time saved of ~492 hours.  

You can find the complete code here and archived photos here. 

Thank you to Jen Fitzgarrald for capturing so many wonderful images over the past decade. 

Credit Card Advice

David Robinson, Chief Data Scientist at DataCamp, once tweeted:

When you’ve written the same code 3 times, write a function. When you’ve given the same advice 3 times, write a blog post.

I’ve recently given advice to a few family members about selecting a credit card so, in the spirit of David’s tweet, I’ve compiled some tips and information about credit cards.

Tips

1. To establish good credit, treat your credit card like a debit card. In other words, it’s good practice to only spend money on the card you know you have in your bank account. Paying off the card balance once (or more) per period is an important factor in establishing a high credit score.

2. Another important factor is the percent utilization of your credit limit. Your first card may have a credit limit of $1,000-2,000 but you should never get close to that limit. In fact, it’s recommended you only use 10-20% of your credit limit at a time. If you have a $1,000 credit limit, spend $150 on the card, pay it off with money from your bank account, and repeat.

3. Compare the rewards each card offers. Since I treat my credit cards like a debit card the only reason I use them is to (1) establish good credit and (2) earn rewards. The rewards can take many forms (cash back, points, miles, etc.) and are earned differently for different purchases (ex. 1% cash back on groceries, 3% cash back on gas) so it’s worth it to carefully compare the offerings.

4. Almost all credit card providers now offer a free way to monitor your credit score. It’s a good idea to check your credit score about once a quarter. That way once you need serious credit (to buy a car or home) you won’t have any surprises or find out that someone has taken loans in your name and ruined your credit.

My Cards

Discover [Link]

My wife and I both have a Discover card. It was a great card to start with because it was specifically targeted to college students with little to no income. We each had a credit line of $1,000. This card gives us unlimited 1% cash back on all purchases. I also got $20 each semester for good grades. To date, I think we’ve earned about $100 with cash back.

American Express [Link]
This was the second card I got. They offered more credit (about $10,000) and use a point system rather than cash back. There’s also a 20% “extra points benefit” if you exceed a certain number of transactions in a cycle.

Capital One “Venture” [Link]
This is our most recent card and the one who use for everything now. Since we are now interested in finding a way to pay for travel home, we wanted a card that offers good travel rewards. We get 2 miles for every dollar spent and earned 50,000 miles for spending $3,000 in the first three months. The link above takes you to page with more information about the card.

What cards do you use? What advice do you have about using credit wisely?

Interactive Investment Tool with R Shiny

R Shiny is a fantastic framework to quickly develop and launch interactive data applications. I recently wrote some investing advice and was looking for a way to illustrate two case studies. Building on an RStudio template, I created a tool to visualize the return of an investment over time, allowing the user to modify each parameter and observe its effect:

Click here for the full-page (non-embedded) version.

Find the full code here or below:

library(FinCal)
library(ggplot2)
library(tidyr)
library(shinythemes)
library(scales)

# Define UI for application that draws a histogram
ui <- shinyUI(fluidPage(theme = shinytheme("spacelab"),
  # Application title
  titlePanel("The Potential for Growth: Two Case Studies"),
  p('An interactive tool to accompany the ', a(href = 'https://unboxed-analytics.com/life-hacking/fundamentals-of-investing/', '"Fundamentals of Investing"'), 'post.'),
  
  # Sidebar with a slider input for number of bins
  sidebarLayout(
    sidebarPanel(
      numericInput(
        inputId = "rate",
        label = "Yearly Rate of Return",
        value = .06,
        min = .01,
        max = .15,
        step = .01
      ),
      p("Represented as a decimal."),
      p(".06 = 6%"),
      numericInput(
        inputId = "years",
        label = "Number of Years",
        value = 43,
        min = 3,
        max = 50,
        step = 1
      ),
      numericInput(
        inputId = "pv",
        label = "Initial Outlay",
        value = 2000,
        min = 1000,
        max = 100000,
        step = 1000.
      ),
      numericInput(
        inputId = "pmt",
        label = "Monthly Contribution",
        value = 0,
        min = 0,
        max = 10000,
        step = 100
      ),
      numericInput(
        inputId = "type",
        label = "Payment Type",
        value = 0,
        min = 0,
        max = 1,
        step = 1
      ),
      p("Indicates if payments occur at the end of each period (Payment Type = 0) or if payments occur at the beginning of each period (Payment Type = 1).")
      ),
    
    mainPanel(plotOutput("finPlot"),
              p("The grey line represents PRINCIPAL and the blue line represents PRINCIPAL + INTEREST."),
              p("Case 1: Suppose you have $2,000 to invest. You use that money to purchase a low-cost, tax-efficient, diversified mutual fund offering an approximate yearly return of 6%."),
              p("You purchase the mutual fund on your 22nd birthday and don’t check your account until your 65th birthday on the day of retirement. After 43 years, you would have over $26,200! Your money has doubled four times."),
              p("Case 2: Suppose again you have $2,000 today to invest. You purchase shares of the same mutual and now, in addition to the initial investment, purchase $100 of additional shares each month. [Adjust the 'Monthly Contribution' sidebar parameter]"),
              p("How much would you have at the end of 43 years? Over $268,400! You have passively created wealth through the market."))
  )
))

# Define server logic required to draw a histogram
server <- shinyServer(function(input, output) {
  output$finPlot <- renderPlot({

    # processing
    total <- fv(r = input$rate/12, n = 0:(12*input$years), pv = -input$pv, pmt = -input$pmt, type = input$type)
    principal <- seq(input$pv, input$pv + (input$years*12)*(input$pmt+.000000001), input$pmt + .000000001)
    interest <- total - principal
    df <- data.frame(period = 0:(12*input$years), total, principal)
    
    # plotting
    ggplot(df, aes(x = period)) + 
      geom_line(aes(y = total), col = "blue", size = .85) +
      geom_line(aes(y = principal), col = "black", size = .85) +
      labs(x = "Period",
           y = "") + 
      scale_y_continuous(labels = dollar) +
      theme(legend.position="bottom") +
      theme(legend.title = element_blank()) +
      theme_minimal()
  })
})

# Run the application
shinyApp(ui = ui, server = server)

Fundamentals of Investing

The Potential for Growth: Two Case Studies

Suppose you have $2,000 today to invest. You use that money to purchase a low-cost, tax-efficient, diversified mutual fund offering a yearly return of 6%.  You purchase the mutual fund on your 22nd birthday and don’t check your account until your 65th birthday on the day of retirement.  After 43 years, you would have over $26,200! Your money has doubled four times.

case-study-1

Now suppose you again have $2,000 to invest. You purchase shares of the same mutual fund. Now, in addition to the initial investment, you purchase $100 of additional shares each month. How much would you have at the end of 43 years? Over $268,400! You have passively created wealth through the market.

Check out this interactive tool for a visual representation of these two cases.

Vision & Goals

Investing is not an end in itself; it is a means of reaching your financial and personal goals. The most common investing goal is saving for a comfortable retirement. You can invest for other goals too: a home down-payment, children’s college, travel, future medical care, or a car.

budget

My personal vision to have enough saved and invested by the age of 45 to have a monthly income of $6,000 from my investments. It won’t come easy: I’ll need to have saved and invested $1,139,000 by then!

Before You Invest

Before you start pouring money into any investment, step back and make sure the rest of your financial life is in order.

First, reduce or eliminate debt. Does it make sense to earn 6% annually on an investment when you pay 24% annually for credit cards or other forms of debt? Second, create an emergency fund worth 3-6 months of expenses. Unexpected events can be stressful and costly. Emergencies take many shapes and sizes such as job loss, medical or dental emergency, unexpected home repairs, or car troubles.

Big Picture

There’s so much investing advice on the internet that it can be hard to condense it all into a few core principles.

The following phrase encapsulates my investing philosophy and serves as a reminder of four fundamentals of investing:

I will pursue low-cost, tax-efficient investments that form a diversified, long-term portfolio.

1. Low-Cost: The Expense Ratio

The cost of an investment largely depends on whether it’s actively or passively managed. Some people are willing to pay a financial advisor an expense ratio of 1-3% to actively manage their investments. Passively managed funds, like index funds that are determined by a computer, are much cheaper.  Look for funds (investments) with expenses ratios in the range of .1 to .3%. This means you’re paying between $1 and $3 for every $1,000 invested. Don’t let your returns be eaten up by fees!

2. Tax-Efficient: Roth vs. Traditional IRA

Tax breaks are a way for the government to incentivize “desirable” behavior. For example, the IRS will let you deduct mortgage loan interest when filing taxes because they’d like to reward home ownership. Because the government also wants you to save for retirement, there are “tax-sheltered” investment vehicles that reward you for saving.

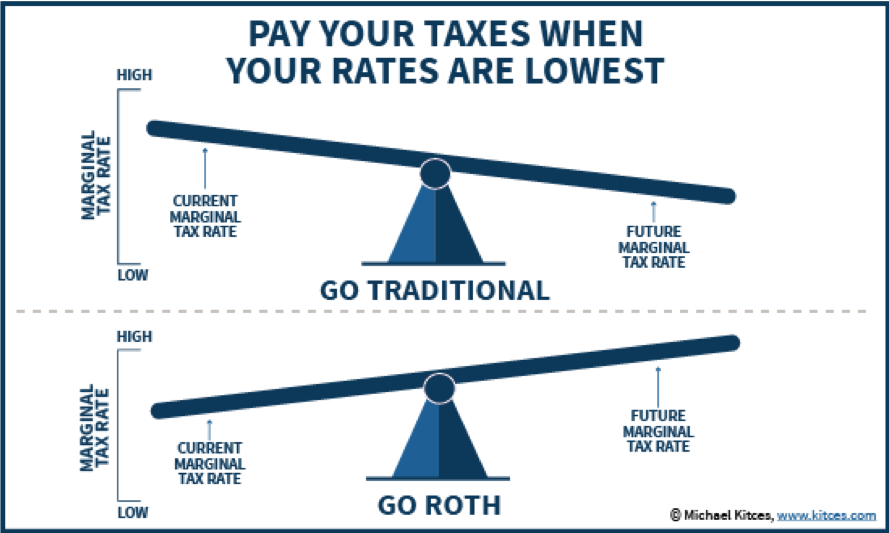
While there are many types of investment vehicles, two kinds to be aware of are the Roth and Traditional IRA (Individual Retirement Account). The image below shows the key difference between the two:

The questions becomes, which is best for me? I use a Roth IRA because I anticipate having a low marginal tax rate when I’m young (when I’m relatively poor) and a high marginal tax rate when I retire (when I hope to be more wealthy).  Another diagram for clarification:


3. Diversified: Asset Classes

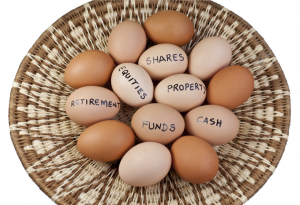
Diversification is your best defense against risk. To be diversified you should invest in different companies, industries, and perhaps even countries that won’t be subject to the same economic factors or risks. This is easily achieved by purchasing a mutual fund that consists of hundreds of companies!

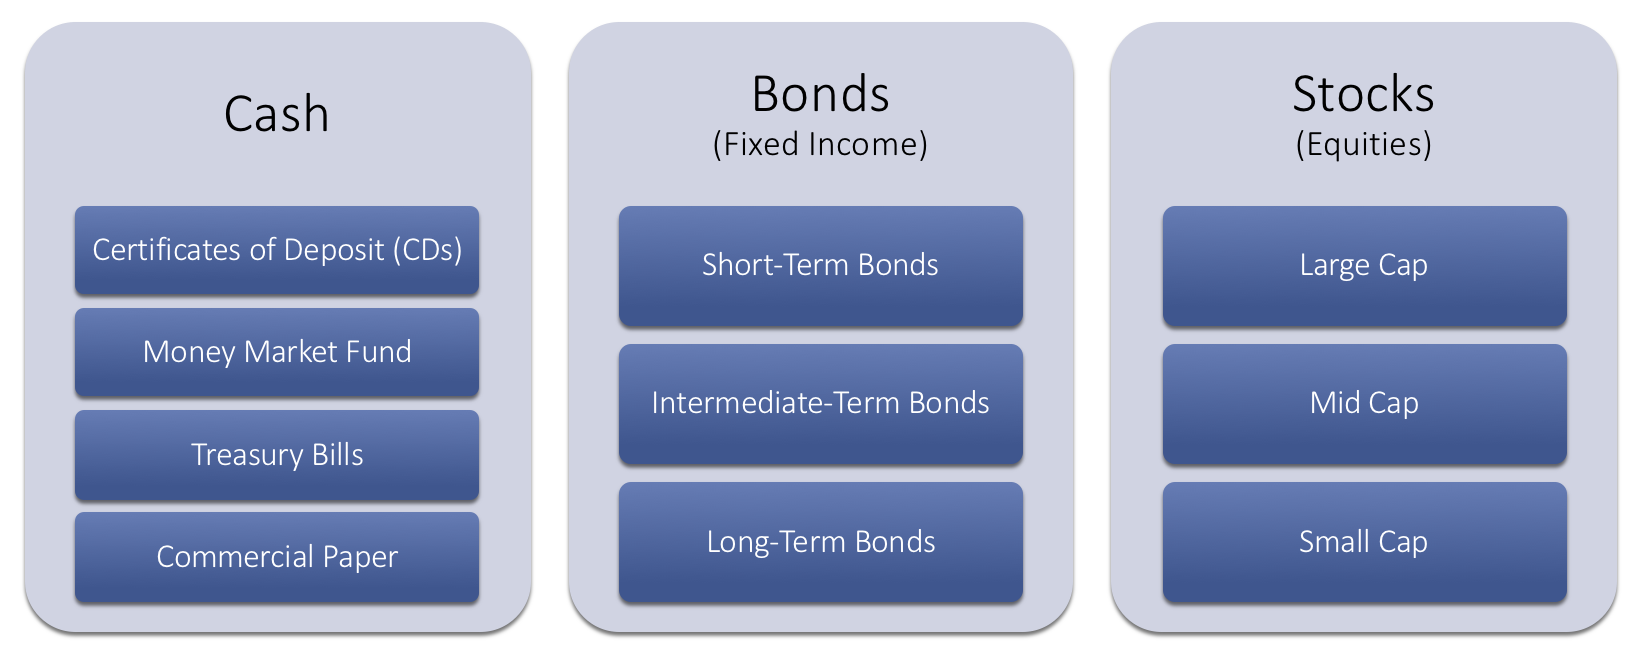
It’s good to be aware that there are several broad categories of assets: cash (and cash equivalents), bonds, and stocks. Diversification usually involves investing in some assets from each category.

4. Long-Term: Passive Approach

Invest for the long run; use a buy-and-hold strategy! There are no “get-rich-quick” schemes that work. Avoid short-term trading. Short-term trading is expensive and incurs transaction costs and taxes. Plan for a time-horizon of 40+ years. Dips and fluctuations in the market will even out over time.

Remember: I will pursue low-cost, tax-efficient investments that form a diversified, long-term portfolio.

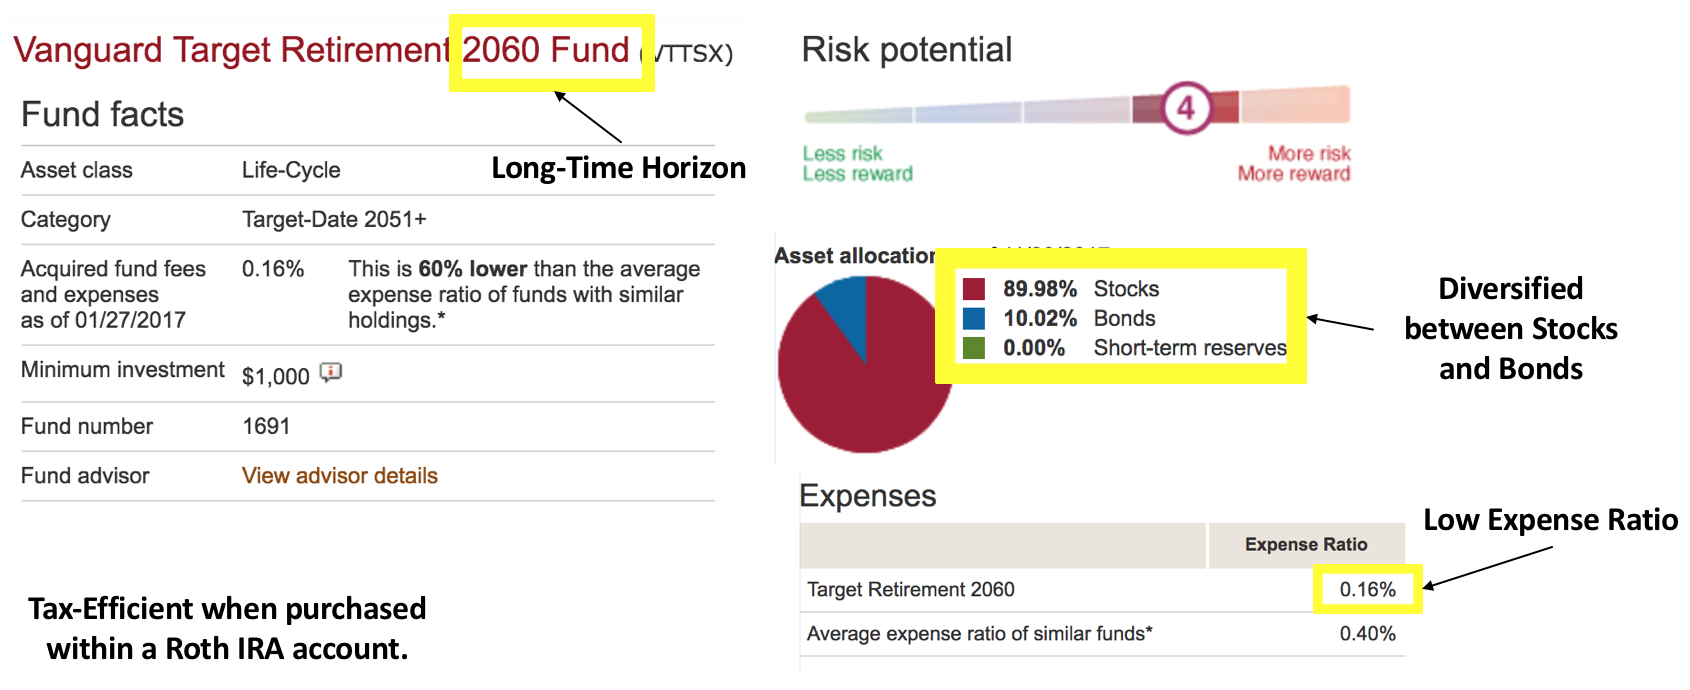
Specific Fund Suggestion

To conclude, here’s a specific example of what to look for when considering an investment. VTTSX is a Vanguard mutual fund with a low expense ratio that automatically adjusts asset allocation as you approach retirement. With 42 years until 2060, this fund is currently mostly made up of stocks, which have higher risk but offer a greater return. As the target date approaches, the fund will swap stocks for bonds to lower the overall risk. The only downside of this fund is the minimum investment threshold, which is $1,000.

Key Terms to Understand

Investing: the act of committing money to an endeavor (a business, project, real estate, etc.) with the expectation of obtaining an additional income or profit. Investing refers to long-term commitment, as opposed to trading or speculating, which are short-term; it is not a get-rich-quick scheme. You can make an investment at a bank, broker, or insurance company.

Asset: A resource with economic value. There are many kinds of assets. Some examples: shares of Apple stock, a US Treasury Bill, a foreign currency such as the Peso, or Coca Cola’s Coke formula, or a mall parking lot.

Asset Class: Categories of assets (investments) that are similar in risk, volatility, and return. The major asset classes are cash and cash equivalents, fixed income (bonds), and equities (stocks). Successful investing largely depends on asset class, rather than asset, selection.

Portfolio: The collection of assets held by an investor. For example, suppose an investor owns $250 worth of US T-bills and $750 worth of Google stock. We would say that this investors portfolio contains 25% bonds and 75% stocks.

Diversification: Investors reduce risk by building a portfolio with different asset classes. For example, rather than buying only stocks, wise investors will also purchase bonds, which tend to perform well when stocks perform poorly.

Return: Different types of investments post different rates of returns. Investments make a return by providing the investor interest, dividends, or capital gains. Returns are the gain or loss generated on an investment and are usually expressed as a percentage. A typical annual return on a moderately aggressive portfolio might range from 7-9%.

Expense Ratio: Institutions (banks, brokers) charge a fee for you to invest. The expense ratio represents the percentage of assets deducted each fiscal year for fund expenses. For example, one Vanguard Mutual fund has an expense ratio of 0.15%. This means It costs $1.5 to invest $1,000.

Mutual Fund: Mutual funds give small investors access to professionally managed portfolios of equities, bonds and other securities. Mutual funds are a great choice for early investors.

Disclaimer: This information is intended for an audience of emerging investors and does not constitute professional advice.

5 Essential iPhone Apps

I’m always looking for apps that enhance my life and productivity. A family member recently purchased a new iPhone and asked for my top app recommendations. Here are five, in no particular order:

1. LastPass [Link]

One master password (or touch ID) unlocks all other passwords, eliminating the need for frequent password resetting. Available both as a mobile app or Chrome extension, LastPass seamlessly and securely syncs across devices. My LastPass ‘vault’ contains overs 125 of my passwords, and with features like autofill and auto-login, my work is never slowed by manual password entry.

2. Pocket [Link]

Everyday I see dozens of things online I don’t have time to read or view in the moment. With Pocket I can save those news articles, blog posts, talks, or tutorials for later viewing, even if offline. Pocket allows me to organize things I’ve saved with tags and eliminates the need for me to send links to myself via email or bookmark web pages. Pocket’s recommendation algorithm (optimized based on the content saved) is spot-on and delivers interesting and relevant articles for me to consume on demand.

3. Moment [Link]

As useful as having a computer in your pocket can be, it’s important to be aware of your device usage and ‘screen time.’ Moment allows me to track how much I use my phone or tablet each day automatically. The ‘insight’ tab provides useful metrics like minutes of screen time, percent of waking life on phone, and the number of pickups by day and week. Moment helps ensure my device usage remains within a healthful limit.

4. Mint [Link]

The king of the personal finance apps, Mint aggregates all of your financial accounts and allows you to manage your money from one place. Rather than check my bank, credit card, and investment accounts separately, Mint displays my nine account balances in near real-time. I’m also able to view my credit score, receive bill reminders, create budgets by category, and set financial goals. Mint is an essential for the financially-savvy.

5. Google Keep [Link]

Google Keep is hand’s down my go-to productivity and note-keeping app, allowing me to capture and record any thought or plan tasks. It’s really an extension of my brain. With features like check-markable boxes for to-do lists and searchable note archives, Keep is an app I interact with dozens of times a day across my devices.

What apps do you love?

css.php