Credit Card Advice

David Robinson, Chief Data Scientist at DataCamp, once tweeted:

When you’ve written the same code 3 times, write a function. When you’ve given the same advice 3 times, write a blog post.

I’ve recently given advice to a few family members about selecting a credit card so, in the spirit of David’s tweet, I’ve compiled some tips and information about credit cards.

Tips

1. To establish good credit, treat your credit card like a debit card. In other words, it’s good practice to only spend money on the card you know you have in your bank account. Paying off the card balance once (or more) per period is an important factor in establishing a high credit score.

2. Another important factor is the percent utilization of your credit limit. Your first card may have a credit limit of $1,000-2,000 but you should never get close to that limit. In fact, it’s recommended you only use 10-20% of your credit limit at a time. If you have a $1,000 credit limit, spend $150 on the card, pay it off with money from your bank account, and repeat.

3. Compare the rewards each card offers. Since I treat my credit cards like a debit card the only reason I use them is to (1) establish good credit and (2) earn rewards. The rewards can take many forms (cash back, points, miles, etc.) and are earned differently for different purchases (ex. 1% cash back on groceries, 3% cash back on gas) so it’s worth it to carefully compare the offerings.

4. Almost all credit card providers now offer a free way to monitor your credit score. It’s a good idea to check your credit score about once a quarter. That way once you need serious credit (to buy a car or home) you won’t have any surprises or find out that someone has taken loans in your name and ruined your credit.

My Cards

Discover [Link]

My wife and I both have a Discover card. It was a great card to start with because it was specifically targeted to college students with little to no income. We each had a credit line of $1,000. This card gives us unlimited 1% cash back on all purchases. I also got $20 each semester for good grades. To date, I think we’ve earned about $100 with cash back.

American Express [Link]
This was the second card I got. They offered more credit (about $10,000) and use a point system rather than cash back. There’s also a 20% “extra points benefit” if you exceed a certain number of transactions in a cycle.

Capital One “Venture” [Link]
This is our most recent card and the one who use for everything now. Since we are now interested in finding a way to pay for travel home, we wanted a card that offers good travel rewards. We get 2 miles for every dollar spent and earned 50,000 miles for spending $3,000 in the first three months. The link above takes you to page with more information about the card.

What cards do you use? What advice do you have about using credit wisely?

Interactive Investment Tool with R Shiny

R Shiny is a fantastic framework to quickly develop and launch interactive data applications. I recently wrote some investing advice and was looking for a way to illustrate two case studies. Building on an RStudio template, I created a tool to visualize the return of an investment over time, allowing the user to modify each parameter and observe its effect:

Click here for the full-page (non-embedded) version.

Find the full code here or below:

library(FinCal)
library(ggplot2)
library(tidyr)
library(shinythemes)
library(scales)

# Define UI for application that draws a histogram
ui <- shinyUI(fluidPage(theme = shinytheme("spacelab"),
  # Application title
  titlePanel("The Potential for Growth: Two Case Studies"),
  p('An interactive tool to accompany the ', a(href = 'https://unboxed-analytics.com/life-hacking/fundamentals-of-investing/', '"Fundamentals of Investing"'), 'post.'),
  
  # Sidebar with a slider input for number of bins
  sidebarLayout(
    sidebarPanel(
      numericInput(
        inputId = "rate",
        label = "Yearly Rate of Return",
        value = .06,
        min = .01,
        max = .15,
        step = .01
      ),
      p("Represented as a decimal."),
      p(".06 = 6%"),
      numericInput(
        inputId = "years",
        label = "Number of Years",
        value = 43,
        min = 3,
        max = 50,
        step = 1
      ),
      numericInput(
        inputId = "pv",
        label = "Initial Outlay",
        value = 2000,
        min = 1000,
        max = 100000,
        step = 1000.
      ),
      numericInput(
        inputId = "pmt",
        label = "Monthly Contribution",
        value = 0,
        min = 0,
        max = 10000,
        step = 100
      ),
      numericInput(
        inputId = "type",
        label = "Payment Type",
        value = 0,
        min = 0,
        max = 1,
        step = 1
      ),
      p("Indicates if payments occur at the end of each period (Payment Type = 0) or if payments occur at the beginning of each period (Payment Type = 1).")
      ),
    
    mainPanel(plotOutput("finPlot"),
              p("The grey line represents PRINCIPAL and the blue line represents PRINCIPAL + INTEREST."),
              p("Case 1: Suppose you have $2,000 to invest. You use that money to purchase a low-cost, tax-efficient, diversified mutual fund offering an approximate yearly return of 6%."),
              p("You purchase the mutual fund on your 22nd birthday and don’t check your account until your 65th birthday on the day of retirement. After 43 years, you would have over $26,200! Your money has doubled four times."),
              p("Case 2: Suppose again you have $2,000 today to invest. You purchase shares of the same mutual and now, in addition to the initial investment, purchase $100 of additional shares each month. [Adjust the 'Monthly Contribution' sidebar parameter]"),
              p("How much would you have at the end of 43 years? Over $268,400! You have passively created wealth through the market."))
  )
))

# Define server logic required to draw a histogram
server <- shinyServer(function(input, output) {
  output$finPlot <- renderPlot({

    # processing
    total <- fv(r = input$rate/12, n = 0:(12*input$years), pv = -input$pv, pmt = -input$pmt, type = input$type)
    principal <- seq(input$pv, input$pv + (input$years*12)*(input$pmt+.000000001), input$pmt + .000000001)
    interest <- total - principal
    df <- data.frame(period = 0:(12*input$years), total, principal)
    
    # plotting
    ggplot(df, aes(x = period)) + 
      geom_line(aes(y = total), col = "blue", size = .85) +
      geom_line(aes(y = principal), col = "black", size = .85) +
      labs(x = "Period",
           y = "") + 
      scale_y_continuous(labels = dollar) +
      theme(legend.position="bottom") +
      theme(legend.title = element_blank()) +
      theme_minimal()
  })
})

# Run the application
shinyApp(ui = ui, server = server)

Fundamentals of Investing

The Potential for Growth: Two Case Studies

Suppose you have $2,000 today to invest. You use that money to purchase a low-cost, tax-efficient, diversified mutual fund offering a yearly return of 6%.  You purchase the mutual fund on your 22nd birthday and don’t check your account until your 65th birthday on the day of retirement.  After 43 years, you would have over $26,200! Your money has doubled four times.

case-study-1

Now suppose you again have $2,000 to invest. You purchase shares of the same mutual fund. Now, in addition to the initial investment, you purchase $100 of additional shares each month. How much would you have at the end of 43 years? Over $268,400! You have passively created wealth through the market.

Check out this interactive tool for a visual representation of these two cases.

Vision & Goals

Investing is not an end in itself; it is a means of reaching your financial and personal goals. The most common investing goal is saving for a comfortable retirement. You can invest for other goals too: a home down-payment, children’s college, travel, future medical care, or a car.

budget

My personal vision to have enough saved and invested by the age of 45 to have a monthly income of $6,000 from my investments. It won’t come easy: I’ll need to have saved and invested $1,139,000 by then!

Before You Invest

Before you start pouring money into any investment, step back and make sure the rest of your financial life is in order.

First, reduce or eliminate debt. Does it make sense to earn 6% annually on an investment when you pay 24% annually for credit cards or other forms of debt? Second, create an emergency fund worth 3-6 months of expenses. Unexpected events can be stressful and costly. Emergencies take many shapes and sizes such as job loss, medical or dental emergency, unexpected home repairs, or car troubles.

Big Picture

There’s so much investing advice on the internet that it can be hard to condense it all into a few core principles.

The following phrase encapsulates my investing philosophy and serves as a reminder of four fundamentals of investing:

I will pursue low-cost, tax-efficient investments that form a diversified, long-term portfolio.

1. Low-Cost: The Expense Ratio

The cost of an investment largely depends on whether it’s actively or passively managed. Some people are willing to pay a financial advisor an expense ratio of 1-3% to actively manage their investments. Passively managed funds, like index funds that are determined by a computer, are much cheaper.  Look for funds (investments) with expenses ratios in the range of .1 to .3%. This means you’re paying between $1 and $3 for every $1,000 invested. Don’t let your returns be eaten up by fees!

2. Tax-Efficient: Roth vs. Traditional IRA

Tax breaks are a way for the government to incentivize “desirable” behavior. For example, the IRS will let you deduct mortgage loan interest when filing taxes because they’d like to reward home ownership. Because the government also wants you to save for retirement, there are “tax-sheltered” investment vehicles that reward you for saving.

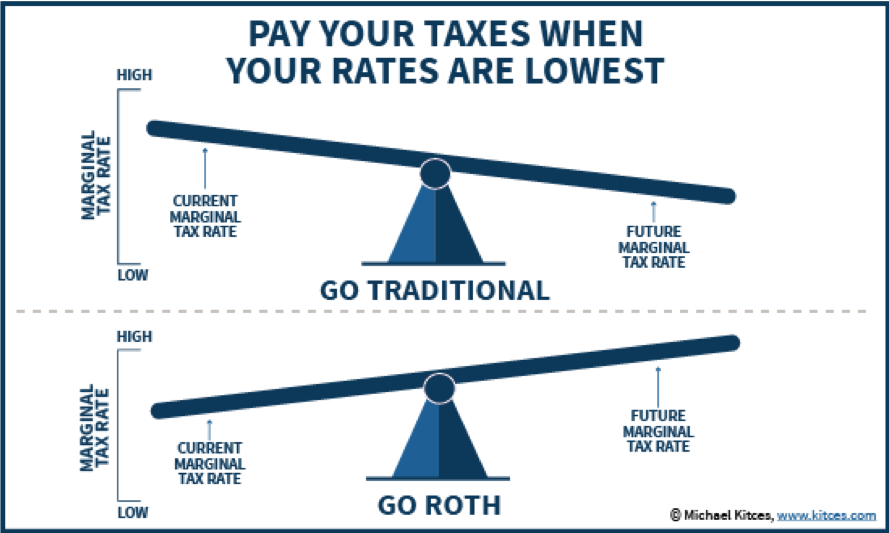
While there are many types of investment vehicles, two kinds to be aware of are the Roth and Traditional IRA (Individual Retirement Account). The image below shows the key difference between the two:

The questions becomes, which is best for me? I use a Roth IRA because I anticipate having a low marginal tax rate when I’m young (when I’m relatively poor) and a high marginal tax rate when I retire (when I hope to be more wealthy).  Another diagram for clarification:


3. Diversified: Asset Classes

Diversification is your best defense against risk. To be diversified you should invest in different companies, industries, and perhaps even countries that won’t be subject to the same economic factors or risks. This is easily achieved by purchasing a mutual fund that consists of hundreds of companies!

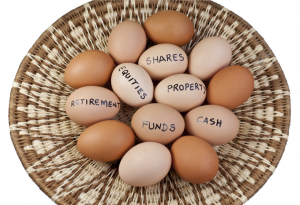
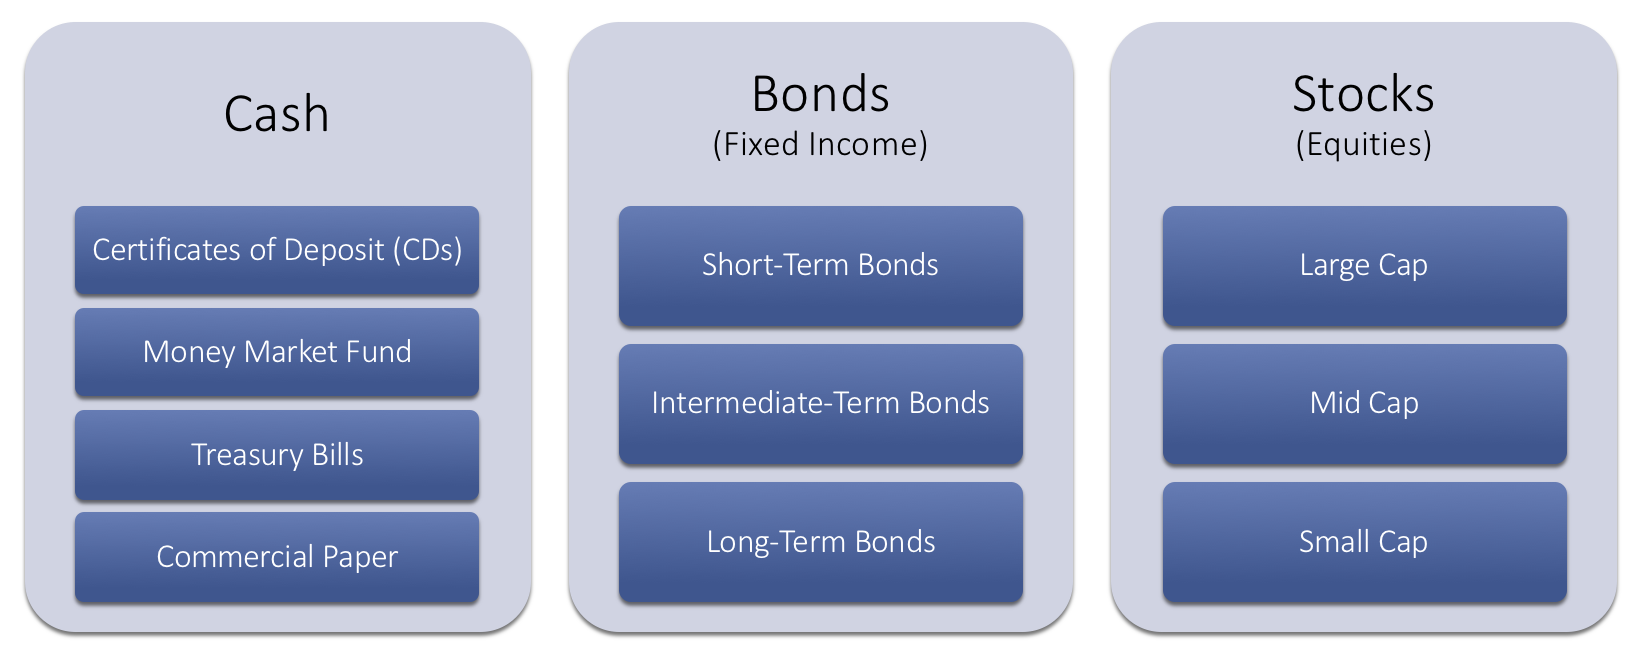
It’s good to be aware that there are several broad categories of assets: cash (and cash equivalents), bonds, and stocks. Diversification usually involves investing in some assets from each category.

4. Long-Term: Passive Approach

Invest for the long run; use a buy-and-hold strategy! There are no “get-rich-quick” schemes that work. Avoid short-term trading. Short-term trading is expensive and incurs transaction costs and taxes. Plan for a time-horizon of 40+ years. Dips and fluctuations in the market will even out over time.

Remember: I will pursue low-cost, tax-efficient investments that form a diversified, long-term portfolio.

Specific Fund Suggestion

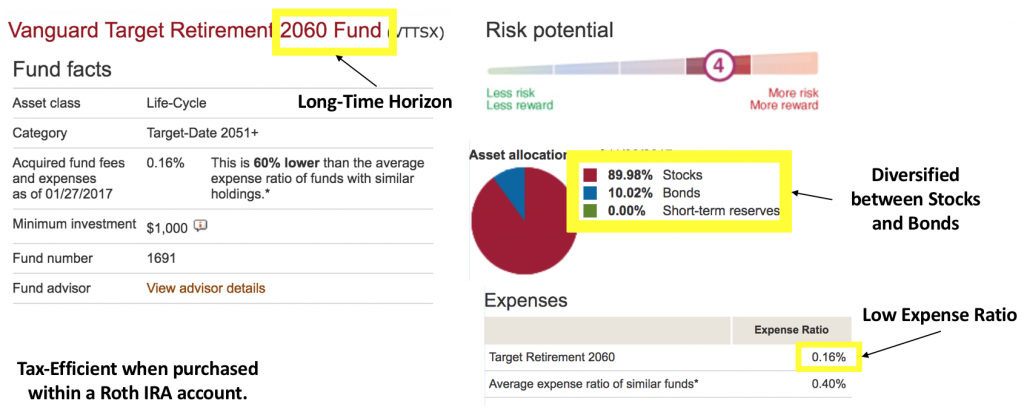
To conclude, here’s a specific example of what to look for when considering an investment. VTTSX is a Vanguard mutual fund with a low expense ratio that automatically adjusts asset allocation as you approach retirement. With 42 years until 2060, this fund is currently mostly made up of stocks, which have higher risk but offer a greater return. As the target date approaches, the fund will swap stocks for bonds to lower the overall risk. The only downside of this fund is the minimum investment threshold, which is $1,000.

Key Terms to Understand

Investing: the act of committing money to an endeavor (a business, project, real estate, etc.) with the expectation of obtaining an additional income or profit. Investing refers to long-term commitment, as opposed to trading or speculating, which are short-term; it is not a get-rich-quick scheme. You can make an investment at a bank, broker, or insurance company.

Asset: A resource with economic value. There are many kinds of assets. Some examples: shares of Apple stock, a US Treasury Bill, a foreign currency such as the Peso, or Coca Cola’s Coke formula, or a mall parking lot.

Asset Class: Categories of assets (investments) that are similar in risk, volatility, and return. The major asset classes are cash and cash equivalents, fixed income (bonds), and equities (stocks). Successful investing largely depends on asset class, rather than asset, selection.

Portfolio: The collection of assets held by an investor. For example, suppose an investor owns $250 worth of US T-bills and $750 worth of Google stock. We would say that this investors portfolio contains 25% bonds and 75% stocks.

Diversification: Investors reduce risk by building a portfolio with different asset classes. For example, rather than buying only stocks, wise investors will also purchase bonds, which tend to perform well when stocks perform poorly.

Return: Different types of investments post different rates of returns. Investments make a return by providing the investor interest, dividends, or capital gains. Returns are the gain or loss generated on an investment and are usually expressed as a percentage. A typical annual return on a moderately aggressive portfolio might range from 7-9%.

Expense Ratio: Institutions (banks, brokers) charge a fee for you to invest. The expense ratio represents the percentage of assets deducted each fiscal year for fund expenses. For example, one Vanguard Mutual fund has an expense ratio of 0.15%. This means It costs $1.5 to invest $1,000.

Mutual Fund: Mutual funds give small investors access to professionally managed portfolios of equities, bonds and other securities. Mutual funds are a great choice for early investors.

Disclaimer: This information is intended for an audience of emerging investors and does not constitute professional advice.

Analyzing iPhone Usage Data in R

I’m constantly thinking about how to capture and analyze data from day-to-day life. One data source I’ve written about previously is Moment, an iPhone app that tracks screen time and phone pickups. Under the advanced settings, the app offers data export (via JSON file) for nerds like me.

Here we’ll step through a basic analysis of my usage data using R. To replicate this analysis with your own data, fork this code and point the directory to your ‘moment.json’ file.

Cleaning + Feature Engineering

We’ll start by calling the “rjson” library and bringing in the JSON file.

library("rjson")
json_file = "/Users/erikgregorywebb/Downloads/moment.json"
json_data <- fromJSON(file=json_file)

Because of the structure of the file, we need to “unlist” each day and then combine them into a single data frame. We’ll then add column names and ensure the variables are of the correct data type and format.

df <- lapply(json_data, function(days) # Loop through each "day"
{data.frame(matrix(unlist(days), ncol=3, byrow=T))})

# Connect the list of dataframes together in one single dataframe
moment <- do.call(rbind, df)

# Add column names, remove row names
colnames(moment) <- c("minuteCount", "pickupCount", "Date")
rownames(moment) <- NULL

# Correctly format variables
moment$minuteCount <- as.numeric(as.character(moment$minuteCount))
moment$pickupCount <- as.numeric(as.character(moment$pickupCount))
moment$Date <- substr(moment$Date, 0, 10)
moment$Date <- as.Date(moment$Date, "%Y-%m-%d")

Let’s create a feature to enrich our analysis later on. A base function in R called “weekdays” quickly extracts the weekday, month or quarter of a date object.

moment$DOW <- weekdays(moment$Date)
moment$DOW <- as.factor(moment$DOW)

With the data cleaning and feature engineering complete, the data frame looks like this:

Minute CountPickup CountDateDOW
131542018-06-16Saturday
53462018-06-15Friday
195642018-06-14Thursday
91522018-06-13Wednesday

For clarity, the minute count refers to the number of minutes of “screen time.” If the screen is off, Moment doesn’t count listening to music or talking on the phone. What about a pickup? Moment’s FAQs define a pickup as each separate time you turn on your phone screen. For example, if you pull your phone out of your pocket, respond to a text, then put it back, that counts as one pickup.

With those feature definitions clarified, let’s move to the fun part: visualization and modeling!

Visualization

I think good questions bring out the best visualizations so let’s start by thinking of some questions we can answer about my iPhone usage:

  1. What do the distributions of minutes and pickups look like?
  2. How does the number of minutes and pickups trend over time?
  3. What’s the relationship between minutes and pickups?
  4. Does the average number of minutes and pickups vary by weekday?

Let’s start with the first question, arranging the two distributions side by side.

g1 <- ggplot(moment, aes(x = minuteCount)) +
  geom_density(alpha=.2, fill="blue") +
  labs(title = "Screen Time Minutes",
       x = "Minutes",
       y = "Density") +
  theme_minimal() + 
  theme(plot.title = element_text(hjust = 0.5))

g2 <- ggplot(moment, aes(x = pickupCount)) +
  geom_density(alpha=.2, fill="red") +
  labs(title = "Phone Pickups",
       x = "Pickups",
       y = "Density") +
  theme_minimal() + 
  theme(plot.title = element_text(hjust = 0.5))

grid.arrange(g1, g2, ncol=2)

On average, it looks like I spend about 120 minutes (2 hours) on my phone with about 50 pickups. Check out that screen time minutes outlier; I can’t remember spending 500+ minutes (8 hours) on my phone!

Next, how does my usage trend over time?

g4 <- ggplot(moment, aes(x = Date, y = minuteCount)) +
  geom_line() +
  geom_smooth(se = FALSE) +
  labs(title = "Screen Minutes Over Time ",
       x = "Date",
       y = "Minutes") +
  theme_minimal() +
  theme(plot.title = element_text(hjust = 0.5))

g5 <- ggplot(moment, aes(x = Date, y = pickupCount)) +
  geom_line() +
  geom_smooth(se = FALSE) +
  labs(title = "Phone Pickups Over Time ",
       x = "Date",
       y = "Pickups") +
  theme_minimal() +
  theme(plot.title = element_text(hjust = 0.5))

grid.arrange(g4, g5, nrow=2)

Screen time appears fairly constant over time but there’s an upward trend in the number of pickups starting in late March. Let’s remove some of the noise and plot these two metrics by month.

moment$monyr <- as.factor(paste(format(moment$Date, "%Y"), format(moment$Date, "%m"), "01", sep = "-"))

bymonth <- moment %>%
  group_by(monyr) %>%
  summarise(avg_minute = mean(minuteCount),
            avg_pickup = mean(pickupCount)) %>%
  filter(avg_minute > 50) %>% # used to remove the outlier for July 2017
  arrange(monyr)

bymonth$monyr <- as.Date(as.character(bymonth$monyr), "%Y-%m-%d")
g7 <- ggplot(bymonth, aes(x = monyr, y = avg_minute)) + 
  geom_line(col = "grey") + 
  geom_smooth(se = FALSE) + 
  ylim(90, 170) + 
  labs(title = "Average Screen Time by Month",
       x = "Date",
       y = "Minutes") +
  theme_minimal() +
  theme(plot.title = element_text(hjust = 0.5))

g8 <- ggplot(bymonth, aes(x = monyr, y = avg_pickup)) + 
  geom_line(col = "grey") + 
  geom_smooth(se = FALSE) + 
  ylim(30, 70) + 
  labs(title = "Average Phone Pickups by Month",
       x = "Date",
       y = "Pickups") +
  theme_minimal() +
  theme(plot.title = element_text(hjust = 0.5))

grid.arrange(g7, g8, nrow=2)
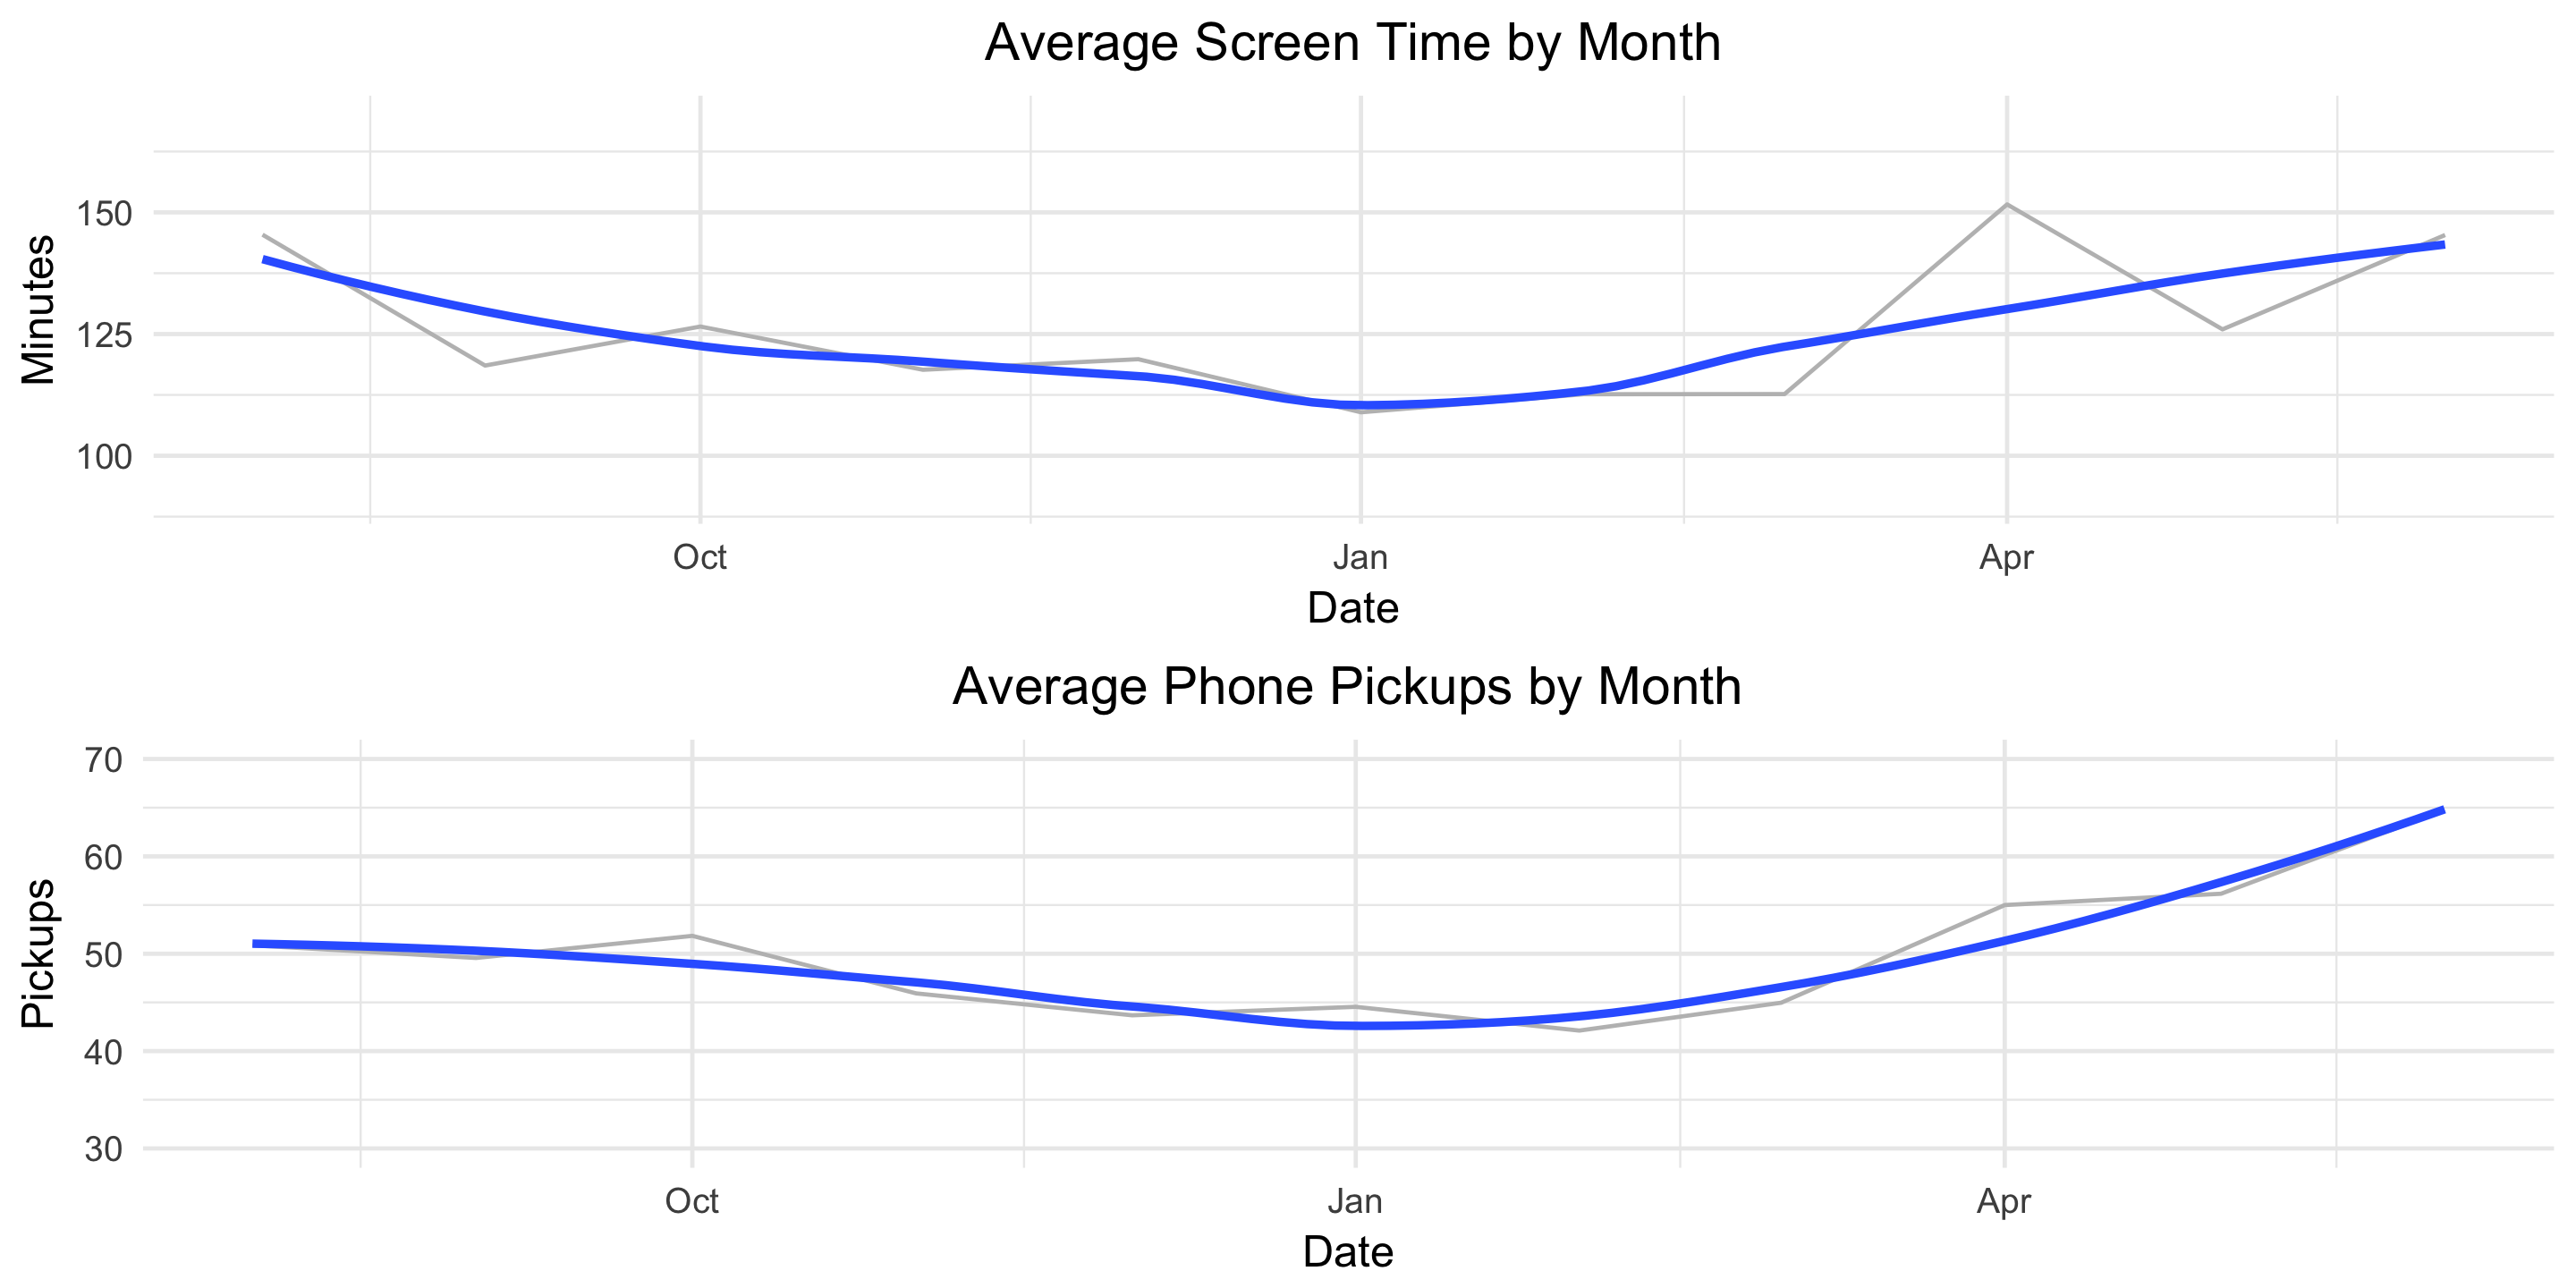
This helps the true pattern emerge. The average values are plotted in light grey and overlayed with a blue, smoothed line. Here we see a clear decline in both screen-time minutes and pickups from August until January and then a clear increase from January until June.

Finally, let’s see how our usage metrics vary by day of the week. We might suspect some variation since my weekday and weekend schedules are different.

byDOW <- moment %>%
  group_by(DOW) %>%
  summarise(avg_minute = mean(minuteCount),
            avg_pickup = mean(pickupCount)) %>%
  arrange(desc(avg_minute))

g10 <- ggplot(byDOW, aes(x = reorder(DOW, -avg_minute), y = avg_minute)) + 
  geom_bar(stat = "identity", alpha = .4, fill = "blue", colour="black") +
  labs(title = "Average Screen Time by DOW",
       x = "",
       y = "Minutes") +
  theme_minimal() +
  theme(plot.title = element_text(hjust = 0.5))

g11 <- ggplot(byDOW, aes(x = reorder(DOW, -avg_pickup), y = avg_pickup)) + 
  geom_bar(stat = "identity", alpha = .4, fill = "red", colour="black") +
  labs(title = "Average Phone Pickups by DOW",
       x = "",
       y = " Pickups") +
  theme_minimal() +
  theme(plot.title = element_text(hjust = 0.5))

grid.arrange(g10, g11, ncol=2)
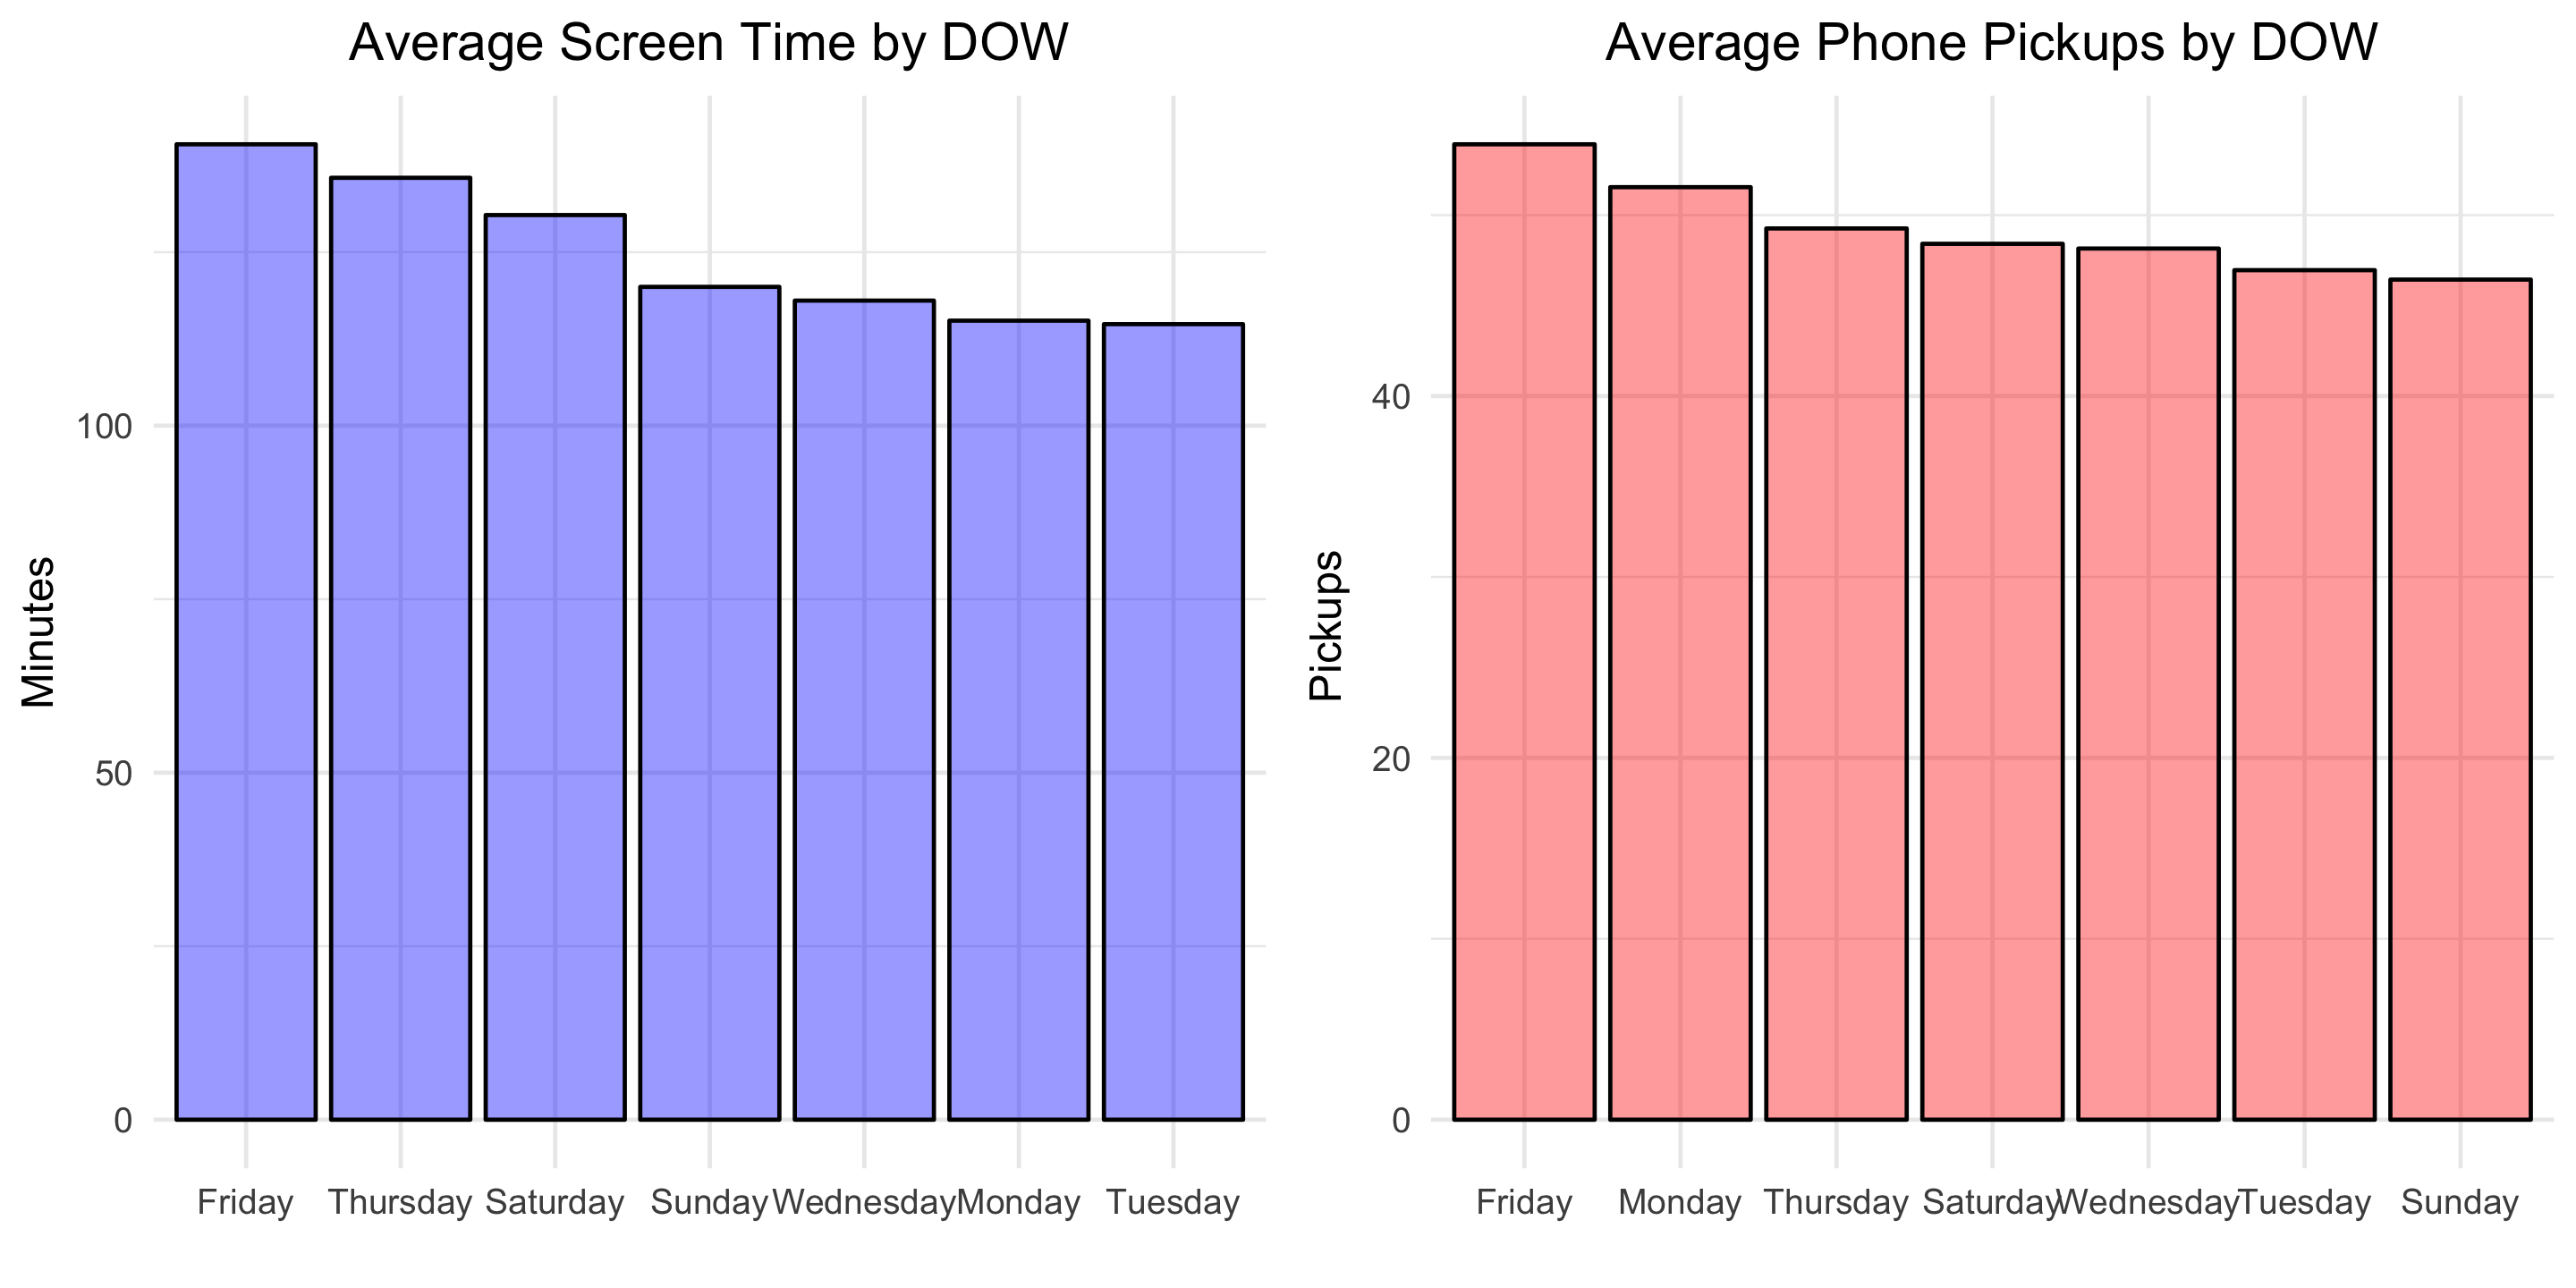
Looks like self-control slips in preparation for the weekend! Friday is the day with the greatest average screen time and average phone pickups.

Modeling

To finish, let’s fit a basic linear model to explore the relationship between phone pickups and screen-time minutes.

fit <- lm(minuteCount ~ pickupCount, data = moment)
summary(fit)

Below is the output:

Coefficients:
            Estimate Std. Error t value Pr(>|t|)    
(Intercept)  39.9676     9.4060   4.249 2.82e-05 ***
pickupCount   1.7252     0.1824   9.457  < 2e-16 ***
---
Signif. codes:  0 ‘***’ 0.001 ‘**’ 0.01 ‘*’ 0.05 ‘.’ 0.1 ‘ ’ 1

Residual standard error: 50.07 on 320 degrees of freedom
Multiple R-squared:  0.2184,	Adjusted R-squared:  0.216 
F-statistic: 89.43 on 1 and 320 DF,  p-value: < 2.2e-16

This means that, on average, each additional phone pickup results in 1.7 minutes of screen time. Let’s visualize the model fit.

g13 <- ggplot(moment, aes(x = pickupCount, y = minuteCount)) + 
  geom_point(alpha = .6) + 
  geom_smooth(method = 'lm', formula = y ~ x, se = FALSE) +
  #geom_bar(stat = "identity", alpha = .4, fill = "blue", colour="black") +
  labs(title = "Minutes of Screen Time vs Phone Pickups",
       x = "Phone Pickups",
       y = "Minutes of Screen Time") +
  theme_minimal() +
  theme(plot.title = element_text(hjust = 0.5))

You can find all the code used in this post here. Download your own Moment data, point the R script towards the file, and Voila, two dashboard-type images like the one below will be produced for your personal enjoyment.

What other questions would you answer?

css.php